 Global| Dec 02 2004
U.S. Light Vehicle Sales Lower
by:Tom Moeller
|in:Economy in Brief
Summary
Unit sales of light vehicles fell another 3.4% m/m last month on top of the 3.1% decline in October to a 16.39M selling rate. Consensus expectations had been for sales of 16.6M. Sales of light trucks again were notably weak, falling [...]
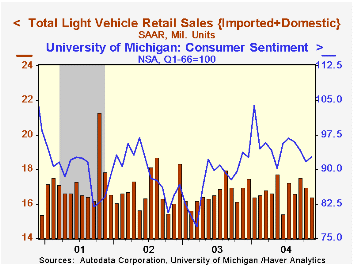
Unit sales of light vehicles fell another 3.4% m/m last month on top of the 3.1% decline in October to a 16.39M selling rate. Consensus expectations had been for sales of 16.6M.
Sales of light trucks again were notably weak, falling 4.1% to the lowest sales rate since June. Domestic light truck sales fell 3.8% m/m (-2.1% y/y) and imported light truck sales were off 5.9% (+1.7% y/y).
Lower sales of imported autos, down 9.7% (+5.4% y/y), led total auto sales 2.5% m/m lower following two months of gain. Sales of domestic autos rose 1.0% (-9.2% y/y).
Imports' share of the US market for new vehicles slipped to 21.0%.
| Light Vehicle Sales (SAAR, Mil. Units) | Nov | Oct | Y/Y | 2003 | 2002 | 2001 |
|---|---|---|---|---|---|---|
| Total | 16.39 | 16.96 | -3.3% | 16.69 | 16.81 | 17.26 |
| Autos | 7.34 | 7.53 | -5.3% | 7.63 | 8.07 | 8.48 |
| Trucks | 9.05 | 9.43 | -1.6% | 9.06 | 8.74 | 8.78 |
by Tom Moeller December 2, 2004
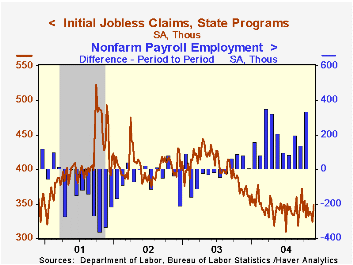
Initial claims for unemployment insurance unexpectedly jumped 25,000 to 349,000 during Thanksgiving week. Holiday periods are notable for seasonal adjustment difficulties. Not seasonally adjusted, claims fell by 36,300. The Consensus expectation had been for 330,000 claims.
The four week moving average of initial claims rose moderately to 336,500 (-8.9% y/y).
During the last ten years there has been a (negative) 82% correlation between the level of initial claims and the y/y change in payroll employment.
Continuing claims for unemployment insurance slumped 20,000 following a downwardly revised 38,000 decline the prior week. The latest is the lowest level since April 2001.
The insured rate of unemployment remained at 2.2% for the eighth week.
The latest Beige Book on regional economic conditions from The Federal Reserve Board is available here.
| Unemployment Insurance (000s) | 11/27/04 | 11/20/04 | Y/Y | 2003 | 2002 | 2001 |
|---|---|---|---|---|---|---|
| Initial Claims | 349 | 324 | -6.2% | 402 | 404 | 406 |
| Continuing Claims | -- | 2,723 | -18.9% | 3,531 | 3,570 | 3,018 |
by Tom Moeller December 2, 2004
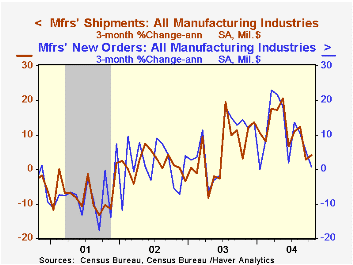
Factory orders rose 0.5% last month following an upwardly revised unchanged reading for September. The recovery was due to a 2.4% gain in nondurable orders (which equal shipments) that primarily reflected an 8.3% jump in shipments from petroleum refineries.
Durable goods orders fell 1.1%, revised from the advance report of a 0.4% drop. The advance report of a 3.3% decline in nondefense capital goods orders was revised to show a 3.9% decline and less aircraft, the decline was revised to -4.2% from -3.6%.
Total shipments out of the US manufacturing sector reversed the prior month's decline with a 1.2% surge, but less petroleum & coal shipments recovered just half of the prior months 1.2% drop (+7.7% y/y). Shipments of computers & electronic products rose 2.8% (+9.4% y/y) after the 2.7% September decline but electrical equipment shipments only gained back 0.4% (4.6% y/y) of a 3.0% September skid.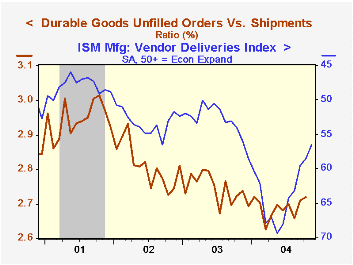
Factory inventory accumulation picked up to 0.5% following a downwardly revised 0.1% September up tick, however the inventory to sales ratio in the factory sector scaled back to 1.24 due to the surge in shipments. Inventories of consumer durables fell 0.1% (+9.7% y/y) after two months of strong accumulation.
Unfilled orders rose 0.5% and the ratio of unfilled orders to shipments for durables added to the sharp gain in September. Supply bottlenecks also are indicated by the ISM's index of vendor delivery speed.
| Factory Survey (NAICS) | Oct | Sept | Y/Y | 2003 | 2002 | 2001 |
|---|---|---|---|---|---|---|
| Inventories | 0.5% | 0.1% | 5.9% | -1.3% | -1.8% | -6.1% |
| New Orders | 0.5% | 0.0% | 8.7% | 3.7% | -1.9% | -6.7% |
| Shipments | 1.2% | -1.1% | 10.6% | 2.6% | -2.0% | -5.4% |
| Unfilled Orders | 0.5% | 0.9% | 8.5% | 4.2% | -6.1% | -5.9% |

Tom Moeller
AuthorMore in Author Profile »Prior to joining Haver Analytics in 2000, Mr. Moeller worked as the Economist at Chancellor Capital Management from 1985 to 1999. There, he developed comprehensive economic forecasts and interpreted economic data for equity and fixed income portfolio managers. Also at Chancellor, Mr. Moeller worked as an equity analyst and was responsible for researching and rating companies in the economically sensitive automobile and housing industries for investment in Chancellor’s equity portfolio. Prior to joining Chancellor, Mr. Moeller was an Economist at Citibank from 1979 to 1984. He also analyzed pricing behavior in the metals industry for the Council on Wage and Price Stability in Washington, D.C. In 1999, Mr. Moeller received the award for most accurate forecast from the Forecasters' Club of New York. From 1990 to 1992 he was President of the New York Association for Business Economists. Mr. Moeller earned an M.B.A. in Finance from Fordham University, where he graduated in 1987. He holds a Bachelor of Arts in Economics from George Washington University.
More Economy in Brief


