 Global| Sep 02 2004
U.S. Light Vehicle Sales Fell in August
by:Tom Moeller
|in:Economy in Brief
Summary
Unit sales of light vehicles in August dropped 3.7% m/m to a 16.60M selling rate. Consensus expectations had been for sales of 17.0M. Lower sales of both autos and light trucks pulled the total down. Auto sales fell 4.7% and truck [...]
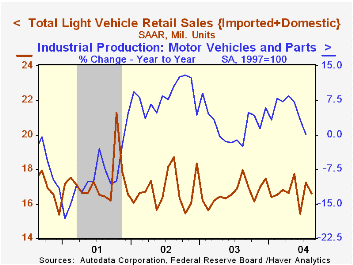
Unit sales of light vehicles in August dropped 3.7% m/m to a 16.60M selling rate. Consensus expectations had been for sales of 17.0M.
Lower sales of both autos and light trucks pulled the total down. Auto sales fell 4.7% and truck sales fell 3.0%.
Domestic light vehicle sales fell 3.7% (-8.0% y/y) and imported vehicle sales dropped 3.7% (-5.5% y/y).
Imports' share of the US market for new vehicles in August was stable at 19.1%.
| Light Vehicle Sales (SAAR, Mil.Units) | Aug | July | Y/Y | 2003 | 2002 | 2001 |
|---|---|---|---|---|---|---|
| Total | 16.60 | 17.24 | -7.5% | 16.69 | 16.81 | 17.26 |
| Autos | 7.15 | 7.50 | -8.8% | 7.63 | 8.07 | 8.48 |
| Trucks | 9.45 | 9.74 | -6.6% | 9.06 | 8.74 | 8.78 |
by Tom Moeller September 2, 2004
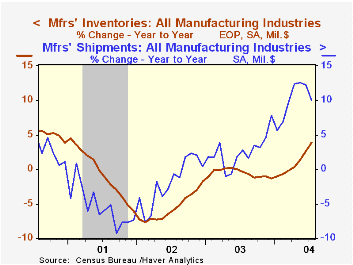
Inventory accumulation in the factory sector is in high gear. Total inventories jumped 0.8% in July and the prior month's strong 0.7% gain was revised to 1.0%. Year to year growth of 3.9% is the strongest since early 2001.
Inventory accumulation has been widespread but notable amongst machinery (5.6% y/y) manufacturers as well as primary (5.9% y/y) & fabricated metals (7.6% y/y) producers.
Unfilled orders again were strong rising 1.2% but the ratio of unfilled orders to shipments ticked up only slightly and remained well below the highs of 2001.
Factory orders surged 1.3% following an upwardly revised 1.2% gain in June. Durable goods orders jumped 1.6% versus the advance report of a 1.7% rise.Non-durable goods orders (which equal shipments) rose 1.0% (11.8% y/y).
Factory shipments surged 0.6% following an upwardly revised 1.1% jump in June. Excluding the transportation sector shipments added 1.3% (12.2% y/y) to the 1.2% June spike.
| Factory Survey (NAICS) | July | June | Y/Y | 2003 | 2002 | 2001 |
|---|---|---|---|---|---|---|
| Inventories | 0.8% | 1.0% | 3.9% | -1.3% | -1.8% | -6.1% |
| New Orders | 1.3% | 1.2% | 11.8% | 3.7% | -1.9% | -6.7% |
| Shipments | 0.6% | 1.1% | 10.0% | 2.6% | -2.0% | -5.4% |
| Unfilled Orders | 1.2% | 0.6% | 9.8% | 4.2% | -6.1% | -5.9% |
by Tom Moeller September 2, 2004
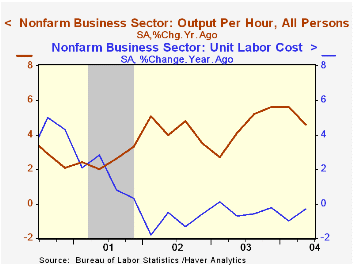
Non-farm labor productivity growth last quarter was revised lower to 2.5% from 2.9% estimated last month. Consensus expectations for 2.7% growth.
The downward revision reflected slower output growth, now set at 3.5% (5.8% y/y) versus 3.8% estimated earlier. Growth in hours worked by all persons (employment times hours) was revised up slightly to 1.0% 91.2% y/y) from 0.8%.
Despite the revision to productivity, growth in unit labor costs was revised down slightly to a still-elevated 1.8% from 1.9%. Compensation growth was lowered to 4.3% from 4.9%.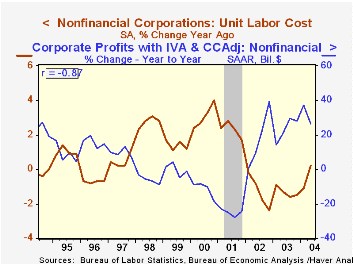
In the nonfinancial corporate sector, productivity grew just 1.4% (3.9% y/y) following a slim 0.2% gain in 1Q and 6.6% growth in 2003. Compensation grew 4.0% (4.1% y/y). Slower productivity growth raised unit labor costs by 2.6% (0.2% y/y) following a 2.1% gain in 1Q and several quarters of decline. During the last ten years there has been an inverse 87% correlation between the y/y growth unit labor costs and the growth in nonfinancial corporate profits.
Productivity in the manufacturing sector was revised lower to 6.9% (5.8% y/y) from 7.5%. Unit labor costs in the factory sector were, however, revised to a 3.5% (-2.5% y/y) decline versus the 2.2% reported initially.
| Non-farm Business Sector (SAAR) | 2Q '04 (Revised) | 2Q '04 (Prelim) | 1Q '04 (Final) | Y/Y | 2003 | 2002 | 2001 |
|---|---|---|---|---|---|---|---|
| Output per Hour | 2.5% | 2.9% | 3.7% | 4.6% | 4.5% | 4.3% | 2.6% |
| Compensation | 4.3% | 4.9% | 4.0% | 4.2% | 4.0% | 3.2% | 4.1% |
| Unit Labor Costs | 1.8% | 1.9% | 0.3% | -0.3% | -0.3% | -1.1% | 1.5% |
by Tom Moeller September 2, 2004
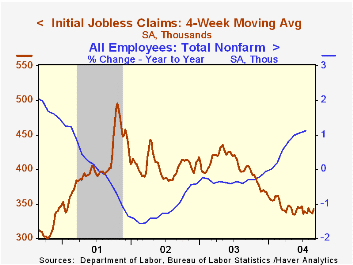
Initial claims for unemployment insurance jumped 19,000 to 362,000 last week on the heels of a 10,000 rise the week prior. Roughly half of both week's increases were due to the impact of Hurricane Charley on claims in Florida, according to the Labor Department. The Consensus forecast had beenfor 335,000 claims.
The 4-week moving average of initial claims rose to 343,000 (-14.4% y/y).
Continuing claims for unemployment insurance fell 5,000 following a downwardly revised 5,000 decline the week prior.
The insured rate of unemployment remained at 2.3%, where it has hovered since the end of April.
| Unemployment Insurance (000s) | 08/28/04 | 08/21/04 | Y/Y | 2003 | 2002 | 2001 |
|---|---|---|---|---|---|---|
| Initial Claims | 362 | 343 | -12.6% | 399 | 403 | 403 |
| Continuing Claims | -- | 2,882 | -19.4% | 3,516 | 3,564 | 2974 |

Tom Moeller
AuthorMore in Author Profile »Prior to joining Haver Analytics in 2000, Mr. Moeller worked as the Economist at Chancellor Capital Management from 1985 to 1999. There, he developed comprehensive economic forecasts and interpreted economic data for equity and fixed income portfolio managers. Also at Chancellor, Mr. Moeller worked as an equity analyst and was responsible for researching and rating companies in the economically sensitive automobile and housing industries for investment in Chancellor’s equity portfolio. Prior to joining Chancellor, Mr. Moeller was an Economist at Citibank from 1979 to 1984. He also analyzed pricing behavior in the metals industry for the Council on Wage and Price Stability in Washington, D.C. In 1999, Mr. Moeller received the award for most accurate forecast from the Forecasters' Club of New York. From 1990 to 1992 he was President of the New York Association for Business Economists. Mr. Moeller earned an M.B.A. in Finance from Fordham University, where he graduated in 1987. He holds a Bachelor of Arts in Economics from George Washington University.
More Economy in Brief


