 Global| Jun 04 2008
U.S. Light Vehicle Sales Down inMay; Truck Sales Lowest Since 1996
by:Tom Moeller
|in:Economy in Brief
Summary
U.S. sales of light vehicles in May fell another 1.1% m/m to a 14.30M unit annual selling rate, according to the Autodata Corporation. It was the fourth m/m decline this year and so far in 2008 vehicle sales have fallen 11.7%. The [...]
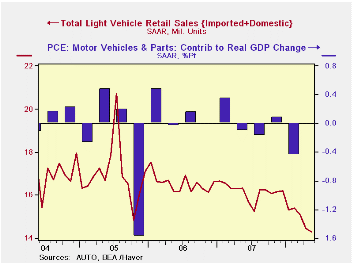
U.S. sales of light vehicles in May fell another 1.1% m/m to a 14.30M unit annual selling rate, according to the Autodata Corporation. It was the fourth m/m decline this year and so far in 2008 vehicle sales have fallen 11.7%. The level of vehicle sales also was lower than Consensus expectations for sales of 14.6M.
Overall, sales of domestically made light vehicles fell 1.3% last month and were off 14.5% YTD, at the lowest level since early 1992.
Higher gasoline prices continued to hit sales of relatively fuel inefficient domestically made light trucks. Sales fell 9.8% m/m during May and that brought the decline this year to 25.6%. Sales of U.S. made cars have held up relatively well and posted an 8.8% increase last month and are roughly unchanged since yearend.
Sales of imported light vehicles slipped just 0.7% m/m to 3.97M units after a 2.1% April decline. Sales of imported autos rose 3.8% after a 0.4% April slip and so far this year sales of imported cars are up 5.8%. Sales of imported light trucks, however, felt some of the effect from higher gas prices and fell 9.7%; off 19.6% so far this year.
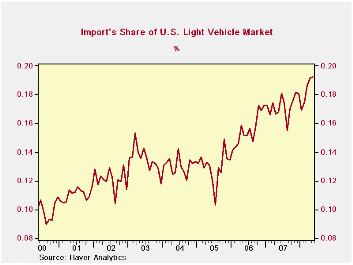
Import's share of the U.S. light vehicle
market rose slightly to another record level of 27.9%. (Imported
vehicles are those produced outside the U.S. and does not include
vehicles with the nameplate of a foreign manufacturer produced within
the U.S.) Imports' share of the U.S. car market rose to 34.6% and the
share of the light truck market was 19.2%; both records and more than
double the shares ten years ago.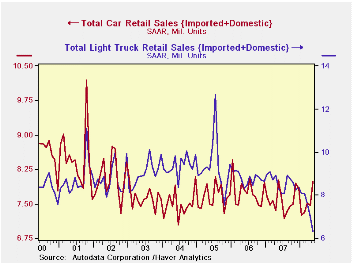
| Light Vehicle Sales (SAAR, Mil. Units) | May | April | Y/Y | 2007 | 2006 | 2005 |
|---|---|---|---|---|---|---|
| Total | 14.30 | 14.46 | -12.5% | 16.17 | 16.54 | 16.96 |
| Autos | 7.98 | 7.46 | -0.3% | 7.58 | 7.77 | 7.65 |
| Domestic | 5.22 | 4.80 | -2.9% | 5.07 | 5.31 | 5.40 |
| Imported | 2.76 | 2.66 | 5.0% | 2.51 | 2.45 | 2.25 |
| Light Trucks | 6.32 | 7.00 | -24.1% | 8.60 | 8.78 | 9.32 |
| Domestic | 5.11 | 5.66 | -26.4% | 7.12 | 7.42 | 8.12 |
| Imported | 1.21 | 1.34 | -13.2% | 1.48 | 1.37 | 1.20 |
by Tom Moeller June 4, 2008
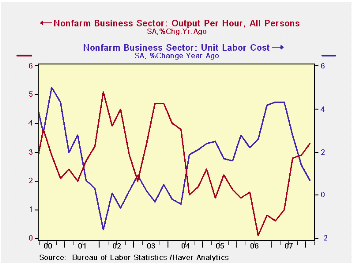
Labor productivity in the nonfarm business sector rose a revised 2.6% last quarter, as expected. That increase was stronger than the 2.2% growth estimated last month and was up from 1.8% growth during 4Q07.
The upward revision was due to an upward revision to output growth to a still low 0.7% from 0.4%. That was accompanied by an unrevised 1.8% decline in total hours worked.
Growth in compensation per hour rose was revised up to 4.9% from 4.4%. The increase, nevertheless, lowered the year-to-year rise to 4.0%, down from 5.8% as of 3Q '07.
Unit labor cost growth was left unrevised at 2.2% after a revised 4.7% surge during 4Q '07. Year-to- year, the growth in costs fell to a modest 0.7%, the slowest rate of growth since a slight decline early in 2004.
In the nonfinancial corporate sector, productivity rose a firm 4.6% (3.0% y/y). That annual increase was the quickest since the end of 2004 while quarterly strength reflected a 3.2% rise in output but a 1.4% decline in hours worked.
Compensation in the corporate sector again was firm and increased 5.9%, a rise which left unit labor costs to increase 1.2% (1.1% y/y).
In the factory sector, productivity rose a somewhat lessened 3.6% (4.0% y/y). Unit labor cost growth was revised up to 4.2% on a quarterly basis but earlier quarterly declines reduced the year-to-year change to -0.2%.
Productivity, Energy Prices, and the Great
Moderation: a New Link is from the Federal Reserve Bank of
Atlanta and it can be found here
.
| Nonfarm Business Sector (SAAR, %) | Q1 '08 (Revised) | Q1 '08 | Q4 '07 | Y/Y | 2007 | 2006 | 2005 |
|---|---|---|---|---|---|---|---|
| Output per Hour | 2.6 | 2.2 | 1.8 | 3.3 | 1.8 | 1.0 | 1.9 |
| Compensation per Hour | 4.9 | 4.4 | 6.6 | 4.0 | 5.1 | 3.9 | 4.0 |
| Unit Labor Costs | 2.2 | 2.2 | 4.7 | 0.7 | 3.2 | 2.9 | 2.0 |
by Tom Moeller June 4, 2008
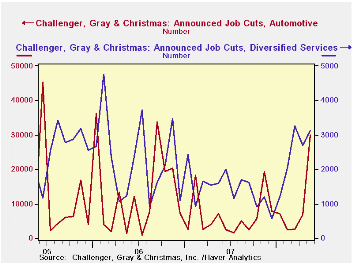
During May, job cut announcements continued to rise according to the Challenger, Grey & Christmas survey. A 15% increase from April to 103,522 pulled the level to its highest since December 2005. Since December announcements have more than doubled and the three-month average of announcements were at the highest level since 2006.
A rise in the three-month average of job cut announcements in
services, financial and automotive sectors led the recent rise.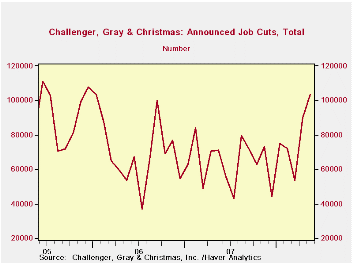
During the last ten years there has been a 76% (inverse) correlation between the three month moving average of announced job cuts and the three month change payroll employment.
Job cut announcements differ from layoffs. Many are achieved through attrition, early retirement or just never occur.
Challenger also reported that announced hiring plans fell by more than one-third and reversed an April gain.
| Challenger, Gray & Christmas | May | April | Y/Y | 2007 | 2006 | 2005 |
|---|---|---|---|---|---|---|
| Announced Job Cuts | 103,522 | 90,015 | 45.6% | 768,264 | 839,822 | 1,072,054 |
by Tom Moeller June 4, 2008
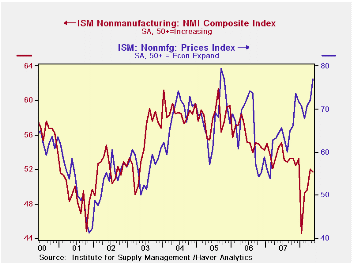
The May Composite Index for the non-manufacturing sector, from the Institute for Supply Management, held about steady with April at 51.7; an improvement from 49.6 in March and well up from the recent low of 44.6 in January. Consensus expectations had been for a lower May reading of 51.0.
Beginning with the January 2008 Non-Manufacturing Report On Business®, a composite index is now calculated as an indicator of the overall economic condition for the non-manufacturing sector. It is a composite index based on the diffusion indexes for four of the indicators (business activity, new orders, employment and supplier deliveries) with equal weights. The latest report from the ISM can be found here.
The non-manufacturing business activity sub-index also improved to 53.6 from 50.9 in April. So far in 2008 the index has averaged a beak-even 49.9, down from 56.0 during all of last year. Since the series' inception in 1997 there has been a 48% correlation between the level of the business activity index for the non-manufacturing sector and the Q/Q change in real GDP for the services and the construction sectors.
The new orders sub-index improved to 53.6 from 50.1 in April but the employment index gave back half of its April improvement and fell to 48.7. The series remained below last year's level of 52.0. Since the series' inception in 1997 there has been a 56% correlation between the level of the ISM non-manufacturing employment index and the m/m change in payroll employment in the service producing plus the construction industries.
Pricing power rose further as the prices paid index rose to 77.0. The latest was the highest level since last November and it was well up from the 2007 average of 63.8. Since inception ten years ago, there has been a 60% correlation between the price index and the q/q change in the GDP services chain price index.
ISM surveys more than 370 purchasing managers in more than 62 industries including construction, law firms, hospitals, government and retailers. The non-manufacturing survey dates back to July 1997.
| ISM Nonmanufacturing Survey | May | April | May '07 | 2007 | 2006 | 2005 |
|---|---|---|---|---|---|---|
| Composite Index | 51.7 | 52.0 | 54.5 | 53.5 | 55.7 | 58.0 |
| Prices Index | 77.0 | 72.1 | 64.3 | 63.8 | 65.3 | 68.0 |
by Tom Moeller June 4, 2008
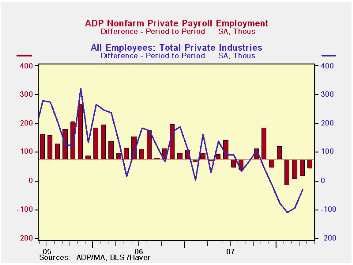
The ADP National Employment Report, from the payroll processor, reported that private nonfarm payrolls rose 40,000 last month after a slightly revised increase 13,000 during April.
>The U.S. Bureau of Labor Statistics May employment figure will be published this Friday.For April, a 13,000 worker rise in ADP's measure of private nonfarm payrolls was accompanied by a 29,000 worker decline in private sector payrolls as reported by BLS.
According to ADP and Macro Advisers, the correlation between the monthly percentage change in the ADP estimate and that in the BLS data is 0.90.
The ADP sub-index for large payrolls fell 18,000 (-1.0% y/y) after a 15,000 worker decline during April.
A 61,000 worker increase (1.3% y/y) in small sized payrolls during May followed a 43,000 April rise.
Medium sized payrolls fell 3,000 (-0.0% y/y).
Employment in the goods producing industries fell another 37,000 (-2.1% y/y) and the rate of decline has intensified as this year has progressed. Services payrolls rose 77,000 (1.3% y/y).
ADP compiled the estimate from its database of individual companies' payroll information. Macroeconomic Advisers, LLC, the St. Louis economic consulting firm, developed the methodology for transforming the raw data into an economic indicator.
The ADP National Employment Report data is maintained in Haver's pUSECONp database; historical data go back to December 2000. The figures in this report cover only private sector jobs and exclude employment in the public sector, which rose an average 11,083 during the last twelve months.
The full ADP National Employment Report can be found here, and the ADP methodology is explained here.
| LAXEPA@USECON | May | April | Y/Y | 2007 | 2006 | 2005 |
|---|---|---|---|---|---|---|
| Nonfarm Private Payroll Employment (m/m Chg.) | 40,000 | 13,000 | 0.7% | 1.1% | 1.7% | 1.8% |
by Robert Brusca June 4, 2008
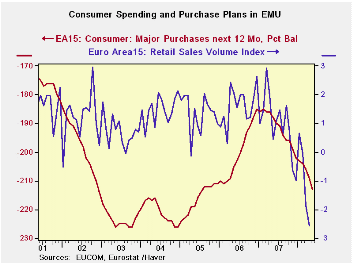
Euro Area retail sales are weak in April just as they were in
March and in February. It’s no surprise then that one month into the
new quarter Retail sales volumes are falling at a 7.6% annual rate, led
by an 8.3% volume drop in nonfood items.
The sequential growth rates for the main aggregates (total,
food and nonfood) show clearly accelerating weakness in retail sales.
It is not hard to see why the OECD cut its forecasts in its new
projections released on Wednesday.
The consumer, his sentiment and his spending habits, are under
clear pressure. Europe’s industrial measures have been held aloft by
strength in capital spending, but it’s time to wonder what is keeping
that aloft. In Japan, a country as well plugged into the overseas
growth markets as any, cap-ex spending turned weak again in the recent
government survey.
Europe seems to have even harder times ahead, made harder
still by and an inflexible ECB over what are actually moderate
inflation pressures during very unusual times with steeply spiking oil
prices. The Fed has not exactly been a fountain of ease but it has done
a lot more for the US economy than that one-trick pony known as the ECB
has done for Europe. Spare the rate, spoil their fate.
| Euro Area (13) Retail Sales Volume | ||||||
|---|---|---|---|---|---|---|
| Apr-08 | Mar-08 | Feb-08 | 3-Mo | 6-MO | 12-Mo | |
| Euro 13 Total | -0.6% | -0.9% | -0.2% | -6.8% | -3.5% | -2.6% |
| Food | -1.0% | -0.3% | 0.1% | -4.7% | -4.3% | -3.4% |
| Non food | -0.5% | -1.2% | -0.4% | -8.2% | -3.0% | -2.0% |
| Textiles | #N/A | -5.0% | 1.1% | -8.5% | -11.4% | -5.0% |
| HH Goods | #N/A | -1.2% | -0.2% | -4.3% | -3.6% | -2.9% |
| Books news, etc | #N/A | -1.5% | -0.2% | 1.8% | 0.2% | -0.3% |
| Pharmaceuticals | #N/A | -0.3% | 0.4% | 2.0% | 1.9% | 2.8% |
| Other NonSpec | #N/A | -1.2% | 0.2% | -1.1% | -1.9% | -2.0% |
| Mail Order | #N/A | -1.3% | -1.1% | -8.2% | -0.8% | 0.1% |
| Non-Food Country Detail Volume | ||||||
| Germany | -4.2% | -1.4% | 1.1% | -16.7% | -4.9% | -4.2% |
| France | #N/A | -1.1% | 0.0% | #N/A | #N/A | #N/A |
| Italy (Total; Value) | #N/A | -0.5% | 0.2% | -0.7% | -0.2% | -0.5% |
| UK(EU) | -1.6% | -0.1% | 1.8% | 0.4% | 4.3% | 4.8% |
| Shaded areas calculated on a one-month lag due to lagging data | ||||||
| The EA 13 countries are Austria, Belgium, Finland, France, Germany, | ||||||
| Greece, Ireland, Italy, Luxembourg, the Netherlands, Portugal, Slovenia | ||||||

Tom Moeller
AuthorMore in Author Profile »Prior to joining Haver Analytics in 2000, Mr. Moeller worked as the Economist at Chancellor Capital Management from 1985 to 1999. There, he developed comprehensive economic forecasts and interpreted economic data for equity and fixed income portfolio managers. Also at Chancellor, Mr. Moeller worked as an equity analyst and was responsible for researching and rating companies in the economically sensitive automobile and housing industries for investment in Chancellor’s equity portfolio. Prior to joining Chancellor, Mr. Moeller was an Economist at Citibank from 1979 to 1984. He also analyzed pricing behavior in the metals industry for the Council on Wage and Price Stability in Washington, D.C. In 1999, Mr. Moeller received the award for most accurate forecast from the Forecasters' Club of New York. From 1990 to 1992 he was President of the New York Association for Business Economists. Mr. Moeller earned an M.B.A. in Finance from Fordham University, where he graduated in 1987. He holds a Bachelor of Arts in Economics from George Washington University.
More Economy in Brief


