 Global| Apr 04 2005
U.S. Light Vehicle Sales Continue Sideways
by:Tom Moeller
|in:Economy in Brief
Summary
Sales of light vehicles in March rose 3.5% versus February to 16.85M units according to Autodata Corporation but the gain only lifted sales to roughly the same level as last year. In 1Q sales averaged 16.45M, down 4.6% versus 17.25M [...]
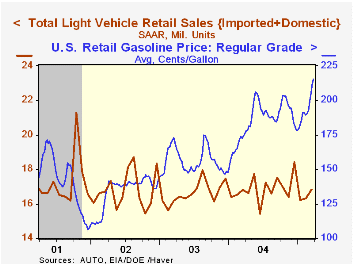
Sales of light vehicles in March rose 3.5% versus February to 16.85M units according to Autodata Corporation but the gain only lifted sales to roughly the same level as last year. In 1Q sales averaged 16.45M, down 4.6% versus 17.25M in 4Q04.
Sales of light trucks rose moderately for the second consecutive month, but the 2.6% m/m gain left sales for the quarter down 5.8% versus 4Q.
Total auto sales rose 4.3% during March. Sales of domestic autos rose 4.9% (-1.3% y/y) and imported car sales rose 2.8% (2.6 y/y).
Imports' share of the US market for new vehicles in March fell slightly m/m to 19.9% and was the same as during 2004.
| Light Vehicle Sales (SAAR, Mil. Units) | Mar | Feb | Y/Y | 2004 | 2003 | 2002 |
|---|---|---|---|---|---|---|
| Total | 16.85 | 16.30 | 0.3% | 16.88 | 16.63 | 16.81 |
| Autos | 7.68 | 7.36 | -0.2% | 7.49 | 7.62 | 8.07 |
| Trucks | 9.17 | 8.94 | 0.7% | 9.39 | 9.01 | 8.74 |
by Tom Moeller April 4, 2005
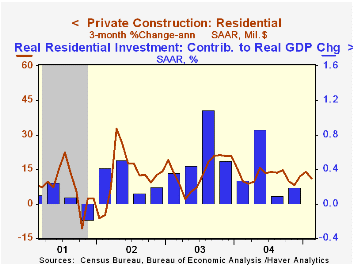
The total value of construction put in place rose 0.4% in February. Consensus expectations had been for a 0.6% gain. Earlier month's figures were little revised.
Private residential building activity rose 0.7% paced by a 1.4% (13.7% y/y) jump in new single family building.
Nonresidential building slipped 1.2% after the strong gain in January as commercial building fell 3.2% (+7.1% y/y). Office building rose 1.6% (3.6% y/y) but manufacturing building fell 2.4% (+28.5% y/y).
Public construction rose 1.1%. Spending on highways & streets, nearly one third of the value of public construction spending, rose 2.5% (21.4% y/y).
These more detailed categories represent the Census Bureau’s reclassification of construction activity into end-use groups. Finer detail is available for many of the categories; for instance, commercial construction is shown for Automotive sales and parking facilities, drugstores, building supply stores, and both commercial warehouses and mini-storage facilities. Note that start dates vary for some seasonally adjusted line items in 2000 and 2002 and that constant-dollar data are no longer computed.
| Construction Put-in-place | Feb | Jan | Y/Y | 2004 | 2003 | 2002 |
|---|---|---|---|---|---|---|
| Total | 0.4% | 0.6% | 10.0% | 8.9% | 5.1% | 1.5% |
| Private | 0.1% | 0.6% | 10.3% | 10.7% | 6.0% | -0.2% |
| Residential | 0.7% | 0.3% | 12.1% | 13.9% | 13.1% | 8.4% |
| Nonresidential | -1.2% | 1.3% | 6.0% | 3.7% | -7.1% | -12.8% |
| Public | 1.1% | 0.7% | 9.0% | 3.3% | 2.6% | 7.0% |
by By Louise Curley April 4, 2005
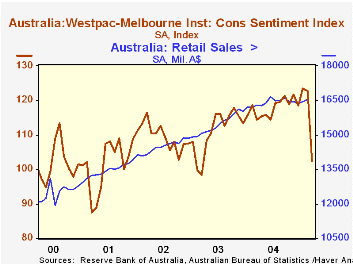
Retail sales in Australia rose 0.6% from A$16,447 million in January to A$16,551 million in February. This was the second month of increase after three successive months of decline, however, the level of sales failed to reach the June 2004 peak of A$16,670 million. Doubts of further increases have risen as a result of the sharp decline in consumer confidence that took place in March. The confidence index tumbled almost 17% from 122.8 to 102.4, the lowest level since March, 2003. While the confidence measure is more volatile than that of retail sales, it seems to be a good indicator of the trend in retail sales as shown in the first chart.
Part of the fall in confidence may have resulted from the Australian Federal Reserve Bank's action in raising its overnight cash rate target from 5.0% to 5.5% on March 2, the first move in 15 months. The Bank noted that the economy, after 13 years of expansion, had less capacity to grow without engendering price increases. Data on official measures of consumer and producer prices in Australia are reported only quarterly. Producer prices for manufacturing accelerated strongly and while the pace of rise was smaller, consumer prices also accelerated in 2004 as shown in the second chart. First quarter data, available soon, may determine whether another rise in the overnight cash target rate is imminent.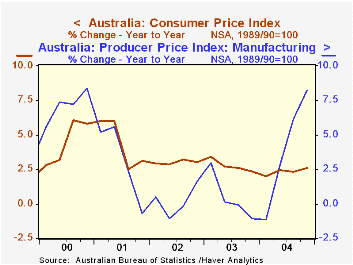
| Australia | Feb 05 | Jan 05 | Feb 04 | M/M% | Y/Y% | 2004 % | 2003% | 2002% |
|---|---|---|---|---|---|---|---|---|
| Retail Sales (Mil A$) | 16,551.9 | 16,447.6 | 16,212.6 | 0.6 | 2.1 | 6.2 | 6.7 | 7.8 |
| Mar 05 | Feb 05 | Mar 04 | M/M% | Y/Y% | 2004 % | 2003% | 2002% | |
| Consumer Confidence | 102.4 | 122.8 | 114.4 | -16.7 | -10.5 | 6.1 | 1.32 | 8.0 |
| Year to Year % Change | Q1 O4 | Q2 04 | Q3 04 | Q4 O4 | ||||
| Consumer Prices | 1.98 | 2.48 | 2.32 | 2.59 | ||||
| Producer Prices | -1.14 | 2.78 | 6.13 | 8.21 |

Tom Moeller
AuthorMore in Author Profile »Prior to joining Haver Analytics in 2000, Mr. Moeller worked as the Economist at Chancellor Capital Management from 1985 to 1999. There, he developed comprehensive economic forecasts and interpreted economic data for equity and fixed income portfolio managers. Also at Chancellor, Mr. Moeller worked as an equity analyst and was responsible for researching and rating companies in the economically sensitive automobile and housing industries for investment in Chancellor’s equity portfolio. Prior to joining Chancellor, Mr. Moeller was an Economist at Citibank from 1979 to 1984. He also analyzed pricing behavior in the metals industry for the Council on Wage and Price Stability in Washington, D.C. In 1999, Mr. Moeller received the award for most accurate forecast from the Forecasters' Club of New York. From 1990 to 1992 he was President of the New York Association for Business Economists. Mr. Moeller earned an M.B.A. in Finance from Fordham University, where he graduated in 1987. He holds a Bachelor of Arts in Economics from George Washington University.
More Economy in Brief


