 Global| Oct 02 2008
U.S. Light Vehicle Sales Backpedal
by:Tom Moeller
|in:Economy in Brief
Summary
U.S. September sales of light vehicles reversed their August rise and fell 8.9%, according to the Autodata Corporation. The sales rate of 12.50M units fell back to its July level, which was the lowest sales rates since 1992. Sales for [...]
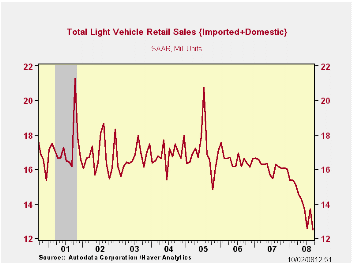
U.S. September sales of light vehicles reversed their August rise and fell 8.9%, according to the Autodata Corporation. The sales rate of 12.50M units fell back to its July level, which was the lowest sales rates since 1992. Sales for the year so far have averaged a 14.12M annual selling rate, down 12.8% from the first nine months of last year. The level of September vehicle sales was quite a bit weaker than Consensus expectations for sales of 13.5M.
Sales of domestically made light vehicles
reversed half of their August gain and fell 8.3% (-23.4% y/y) to 9.44M
units. Year-to-date, sales were down 14.8% from the first nine months
of last year. Domestically made light truck sales continued to suffer
due to higher gasoline prices, falling 11.8% (-28.1% y/y). That decline
reversed nearly half of their 28.1% August gain. Truck sales this year
were 21.1% lower than during the first nine months of 2007. Sales of
U.S.- made cars fell a lesser 3.7% from August. Drivers' shift to
purchases of relatively fuel efficient vehicles left sales down a less
severe 5.9% versus the first nine months of last year.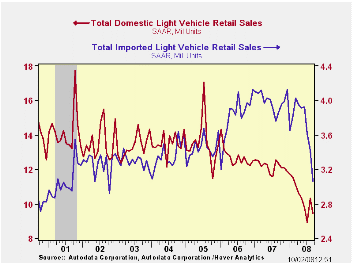
Sales of imported light vehicles fell a sharp 10.5% (-20.7% y/y) in September to 3.06 million units, the lowest level since 2002.Sales of imported autos dropped another 16.5% m/m to 1.94M on top of their 8.4% decline. The latest was their lowest sales rate since January 2006. Year-to-date, sales were down 6.8% from the first nine months of 2007.Imported light truck sales ticked up another 2.3% (-24.7% y/y). However, they too felt the effect of higher fuel costs and were down 15.4% versus the first nine months of last year.
Import's share of the U.S. light vehicle market fell again, last month to 24.5%, the lowest since this past January. (Imported vehicles are those produced outside the U.S. and does not include vehicles with the nameplate of a foreign manufacturer produced within the U.S.).
Who really made your car? from the Federal Reserve Bank of Chicago is available here.
Economy in lower gear through 2008 also from the Federal Reserve Bank of Chicago can be found here.
| Light Vehicle Sales (SAAR, Mil. Units) | September | August | Y/Y | 2007 | 2006 | 2005 |
|---|---|---|---|---|---|---|
| Total | 12.50 | 13.72 | -22.8% | 16.17 | 16.54 | 16.96 |
| Autos | 6.19 | 6.74 | -17.2 | 7.58 | 7.77 | 7.65 |
| Domestic | 4.25 | 4.41 | -16.8 | 5.07 | 5.31 | 5.40 |
| Imported | 1.94 | 2.33 | -18.2 | 2.51 | 2.45 | 2.25 |
| Light Trucks | 6.31 | 6.98 | -27.6 | 8.60 | 8.78 | 9.32 |
| Domestic | 5.19 | 5.89 | -28.1 | 7.12 | 7.42 | 8.12 |
| Imported | 1.12 | 1.09 | -24.7 | 1.48 | 1.37 | 1.20 |
by Tom Moeller October 2, 2008
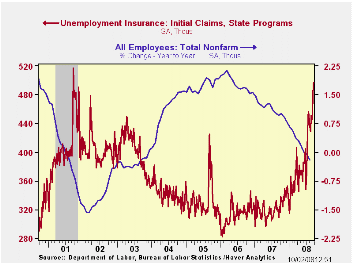
Initial claims for unemployment insurance rose to 497,000 from an upwardly revised 496,000 during the week prior. The latest was the highest level since the recession of 2001.
The four-week moving average jumped to 474,000 (48.8% y/y) which also was the highest level since the last recession. During August initial claims averaged 443,000.
A claims level below 400,000 typically has been associated
with positive growth in nonfarm payrolls. During the last ten years
there has been a (negative) 76% correlation between the level of
initial claims and the m/m change in nonfarm payroll employment. Over
the longer period of time, the level of claims for jobless insurance
has not trended higher with the size of the labor force due to a higher
proportion of self-employed workers who are not eligible for benefits.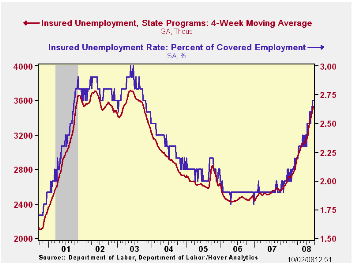
Continuing claims for unemployment insurance during the latest week rose another 48,000 after a 95,000 rise during the prior period. The four-week average of claims rose to 3,528,500. That was the highest level since 2003. Continuing claims provide some indication of workers' ability to find employment and they lag the initial claims figures by one week.
The insured rate of unemployment was stable at 2.7%. The rate for the previous week was upwardly revised and it is the highest level since late-2003.
Technology shocks, employment, and labor market frictions from the Federal Reserve Bank of Boston is available here.
| Unemployment Insurance (000s) | 09/27/08 | 09/20/08 | Y/Y | 2007 | 2006 | 2005 |
|---|---|---|---|---|---|---|
| Initial Claims | 497 | 496 | 53.4% | 322 | 313 | 331 |
| Continuing Claims | -- | 3,591 | 40.5 | 2,552 | 2,459 | 2,662 |
by Tom Moeller October 2, 2008
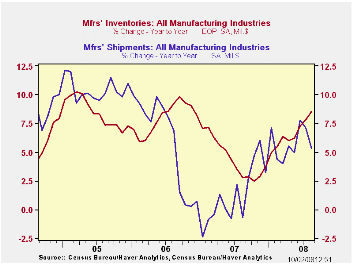
Factory inventories increased another 0.6% during August, the same as during July. That lifted the y/y gain to 8.6%, its strongest since late 2006. Growth in inventories within the transportation sector has been strong at 14.6% y/y. Yet less the transportation sector inventory growth similarly was firm. The y/y gain of 7.5% was the strongest since late 2006.
Inventories of transportation equipment has been notable at 14.6% y/y led by a 32.6% bulge in inventories of nondefense aircraft & parts. Defense aircraft inventories also were strong and posted a 12.9% jump. Automobile inventories fell 6.0% y/y and light truck inventories were off 15.4%. Growth in inventories of primary metals also has been notable at 11.9% y/y while fabricated metals inventories rose 8.0%. Electrical equipment & appliance inventories grew a stable 5.4% while growth in machinery inventories also was stable at 6.4%.
Total factory orders fell 4.0% during August versus
expectations for a 2.4% drop. The decline reflected the already
reported 4.8% shortfall in durable goods orders. They were pulled lower
by a 9.1% decline in new orders for transportation equipment.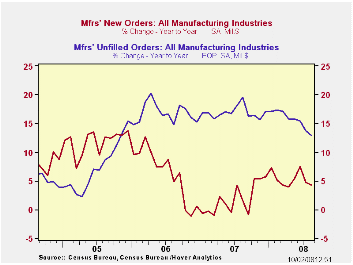
Factory shipments similarly dropped 3.5%, led by an 8.0% (-15.5% y/y) drop in transportation sector shipments. Shipments of electrical equipment also were weak and they posted a 4.6% (-1.2% y/y) decline. Electronic computer shipments fell 3.3% (-11.8% y/y) as did shipments of furniture & related products (-6.4% y/y). Shipments from petroleum refineries were weak last month and posted a 9.1% drop with lower prices. Year-to-year, however, they were still up 49.6%.
Overall unfilled orders rose 0.4% and 12.9% y/y. Much of the strength over the last year has been due to the 24.5% gain in order backlogs of nondefense aircraft & parts. Order backlogs for electronic computers fell slightly but order backlogs of machinery surged (23.2% y/y).
The latest Business Outlook Survey from the Federal Reserve Bank of Philadelphia is available here.
| Factory Survey (NAICS, %) | August | July | Y/Y | 2007 | 2006 | 2005 |
|---|---|---|---|---|---|---|
| Inventories | 0.6 | 0.6 | 8.6 | 3.7 | 6.4 | 8.9 |
| Excluding Transportation | 0.6 | 0.5 | 7.5 | 2.7 | 7.9 | 8.1 |
| New Orders | -4.0 | 0.7 | 4.2 | 1.9 | 6.2 | 11.9 |
| Excluding Transportation | -3.3 | 0.5 | 8.4 | 1.2 | 7.4 | 11.7 |
| Shipments | -3.5 | 1.4 | 5.3 | 1.2 | 5.9 | 10.4 |
| Excluding Transportation | -2.9 | 1.3 | 8.7 | 1.5 | 6.7 | 11.4 |
| Unfilled Orders | 0.4 | 0.8 | 12.9 | 17.1 | 15.3 | 15.4 |
| Excluding Transportation | 0.2 | 0.9 | 9.3 | 8.2 | 16.0 | 9.2 |
by Robert Brusca October 2, 2008
Today Jean Claude Trichet opened the door to a consideration of changing interest rates in the direction of a cut. It was a surprise and the impact of the statement stung the euro. But be clear that inflation remains wildly over the top of the ECB ceiling. Trichet speaks of increased risk to the downside of the economy but continues to give lip service to upside (inflation) risks lingering. It does not seem he is yet ready to unlock the way. The way is shut, as Aragon once was told in the Lord of the Rings trilogy. Of course he eventually found a way to open it and save the day, as may Trichet.
And while PPI headline pressures have abated at long last, the picture and the dynamics of the PPI are still NOT what you would like to see if you are a central bank wanting to cut rates. The ECB that prides itself on being a one-mandate central bank is in no position to ague that it has done any better a job on the inflation fighting than has the Federal Reserve in the US with multiple mandates.
The PPI fell by a sharp 0.5% in August (PPI excluding construction) a huge drop really and with that drop, three month inflation is now ‘down’ to 7.3% at an annual rate. It breaks an accelerating trend for headline inflation that is at 9.5%, higher than its 12-month rate at 8.5% and that is higher than its year-ago annual rate of 1.8%.
Still, PPI inflation ex-energy continued to rise. The 0.2% gain is moderate but it comes on the heels of a 0.6% rise in July. Three month ex-energy PPI inflation is at a pace of 4.6% over 3-and 6-months and that pace is an acceleration from its 4.3% yr/yr pace.
By component the PPI is not behaving all that well either:
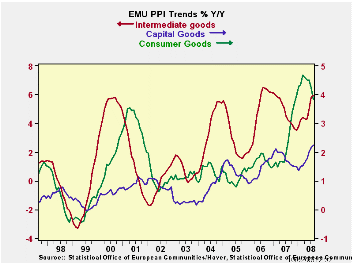
- Capital goods inflation is moderate but still exceeds the 2% HICP ceiling that the ECB sets. Moreover at 2.5% over three-months the pace is higher than its 2.3% over six months and its 2.2% yr/yr. Capital goods inflation may not be accelerating that much but it is still accelerating. Capital goods prices did rise by just 0.1% in August, however.
- Consumer goods inflation also is excessive but this is the sort of series a central bank could live with and still cut rates. With a rise of just 0.1% in August its three-month pace is 2.2%, its six-month pace is 2.5% and its Yr/Yr pace is 3.8% - far too high but definitely it has the right trend in place.
- For intermediate goods, prices rose by 0.2% in August and at a 6% pace over three-months, a 5.8% pace over six months and a 4.6% pace over 12-months. Not only is the pace is too high here but the trend is all wrong.
By Country Trends: Ex energy trends for Germany, Italy and the UK show a break off from a pattern of acceleration in the recent three-months. Still, for each of these counties the ex-energy PPI pace remains torrid at 3.7% over three-months for Italy, the lowest three-month pace of the group; at 6.5% the UK has the highest 3-mo ex energy pace.
The ECB will not be making monetary policy decisions based on the PPI. But the PPI is a pulse of inflation that the economy must deal with as it feeds into wholesalers and retailers and exporters. We can see clearly the weakness in the US economy and doubters now know that Europe remains linked to the US business cycle and its brief foray with de-coupling merely extended the leash that tethers it for a few added months. In seeing the weak US economy especially the ongoing construction drop and sharp fall in MFG via the ISM index Europe can see with some clarity the road ahead. It’s no wonder that Trichet wants to get out in front of the next big bend in the road. But he is careful about braking too soon since inflation is closing the gap on him and still tailgating at a rapid speed. The ECB would like inflation to show a milder hand and a broader trend of deceleration at least ex energy to salve its credibility were it to cut rates with the headline HICP above 2% by large margin.
This is the reason why HEADLINE INFLATION TARGETING IS WRONG.
I saw a rather dumb movie yesterday on cable in which the main actor made the point to a little boy he was coaching. He said don’t make a promise you can’t keep, kid: dumb movie, but good advice. Europe and the UK have this problem to a far greater extent than does the US. While the US central bank is still criticized for targeting the wrong thing (core) The Fed is closer to keeping inflation within reason of its ‘zone of preference’ than is the ECB. Interestingly each country has very similar year over Year headline and core inflation traits. So the ECB’s headline pledge did not really cause it to react any differently than did the Fed. I would repeat this notion that for a central bank you should not target something unless to are serious about hitting it. And no one is serious about containing inflation at a 2% ceiling as oil prices spurt as they did. For core inflation that’s another matter. And even with its banking crises and dual mandate the Fed is holding closer to its desired mark than is the ECB – and by a long shot. So who has credibility here: the Fed or the ECB?
| Euro Area and UK PPI Trends | ||||||
|---|---|---|---|---|---|---|
| M/M | Saar | |||||
| Euro Area 15 | Aug-08 | Jul-08 | 3-Mo | 6-MO | Yr/Yr | Y/Y Yr Ago |
| Harmonized PPI excl Construction | -0.5% | 1.3% | 7.3% | 9.5% | 8.5% | 1.8% |
| Excl Energy | 0.2% | 0.6% | 4.6% | 4.6% | 4.3% | 3.0% |
| Capital Gds | 0.1% | 0.3% | 2.5% | 2.3% | 2.2% | 1.7% |
| Consumer Gds | 0.1% | 0.2% | 2.2% | 2.5% | 3.8% | 2.4% |
| Intermediate & Capital Goods | 0.2% | 0.7% | 6.0% | 5.8% | 4.6% | 3.2% |
| Energy | -2.5% | 3.2% | 14.8% | 25.2% | 22.5% | -1.9% |
| MFG | -0.6% | 0.6% | 3.1% | 7.1% | 6.5% | 2.3% |
| Germany | -0.6% | 2.0% | 9.2% | 10.4% | 8.1% | 1.0% |
| Excl Energy | 0.2% | 0.7% | 4.6% | 4.3% | 3.5% | 2.6% |
| Italy | -0.2% | 0.8% | 5.4% | 8.6% | 8.2% | 2.1% |
| Excl Energy | 0.2% | 0.2% | 3.7% | 4.6% | 4.2% | 3.1% |
| UK | -1.8% | 0.9% | 7.3% | 16.5% | 18.6% | 0.3% |
| Excl Energy | 0.2% | 0.6% | 6.5% | 9.8% | 7.7% | 3.0% |
| The EA 15 countries are Austria, Belgium, Cyprus, Finland, France, Germany, Greece, Ireland, Italy, Luxembourg, Malta, Netherlands, Portugal, Slovenia and Spain. | ||||||

Tom Moeller
AuthorMore in Author Profile »Prior to joining Haver Analytics in 2000, Mr. Moeller worked as the Economist at Chancellor Capital Management from 1985 to 1999. There, he developed comprehensive economic forecasts and interpreted economic data for equity and fixed income portfolio managers. Also at Chancellor, Mr. Moeller worked as an equity analyst and was responsible for researching and rating companies in the economically sensitive automobile and housing industries for investment in Chancellor’s equity portfolio. Prior to joining Chancellor, Mr. Moeller was an Economist at Citibank from 1979 to 1984. He also analyzed pricing behavior in the metals industry for the Council on Wage and Price Stability in Washington, D.C. In 1999, Mr. Moeller received the award for most accurate forecast from the Forecasters' Club of New York. From 1990 to 1992 he was President of the New York Association for Business Economists. Mr. Moeller earned an M.B.A. in Finance from Fordham University, where he graduated in 1987. He holds a Bachelor of Arts in Economics from George Washington University.
More Economy in Brief


