 Global| Sep 21 2009
U.S. Leading Indicators Rise ForAFifth Straight Month And Signal Economic Recovery
by:Tom Moeller
|in:Economy in Brief
Summary
Extraordinary developments continued to characterize the US financial system through Q2, as indicated in the Federal Reserve's flow-of-funds accounts, published today at noon. Two sectors in particular caught our attention, households [...]
 Extraordinary
developments continued to characterize the US financial system through
Q2, as indicated in the Federal Reserve's flow-of-funds accounts,
published today at noon. Two sectors in particular caught our
attention, households and the federal government, each for opposing
reasons.
Extraordinary
developments continued to characterize the US financial system through
Q2, as indicated in the Federal Reserve's flow-of-funds accounts,
published today at noon. Two sectors in particular caught our
attention, households and the federal government, each for opposing
reasons.
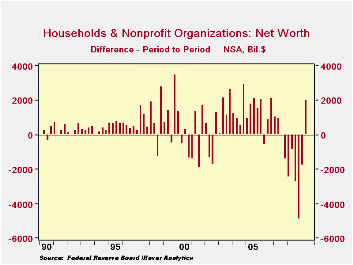
First, after six consecutive quarters of deterioration, household net worth finally experienced an improvement. It increased $2.0 trillion to $53.1 trillion. The biggest gains came from the upturn in the stock market, which added $1.1 trillion to people's assets. Additionally, mutual fund holdings gained $486 billion, and pension fund reserves -- largely invested in equities, of course -- added $742 billion. Among tangible assets, household real estate values rose by $323 billion following nine consecutive quarters of erosion.
Household financial positions also improved because they continued to pay down liabilities. These changes were small compared to the asset moves, but clearly still in a favorable direction; total liabilities fell $35 billion in Q2, the fourth reduction in the last five quarters. Mortgage debt and consumer credit had the largest declines, while conventional bank loans increased.
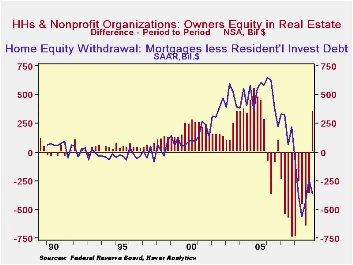
In these comparisons, the concept of "mortgage equity
withdrawal" plays a role. Homeowners' equity in real estate
increased in Q2 by $353 billion. It had contracted in 12 of
the last 13 quarters, a span extending back to the beginning of 2006
and interrupted by just a token increase in Q4 2006. For the
first year of this period, the reductions were evidently deliberate on
the part of consumers, who borrowed heavily against their
properties. Such "mortgage equity withdrawal" became a
popular addition to economists' tools for forecasting consumer
spending, which could be larger still when income was augmented by
liquidations of home values. This practice dwindled rapidly
however as real estate prices began to decline in 2007 and according to
the Haver measure, "MEW" turned negative last year. So people
began borrowing a smaller portion of the value of the real estate they
were purchasing or remodeling to try to hold a larger equity
stake. In the aggregate this effort was subverted by the the
continuing decline in real estate prices in general.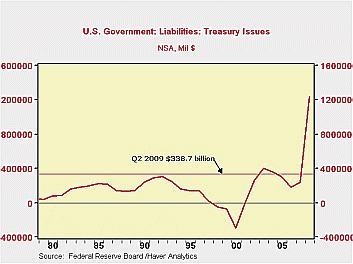 Finally,
though, this last quarter saw homeowners' equity go up. As
noted above, the value of real estate increased some $323
billion. Our measure of MEW declined by about $90 billion,
and mortgage debt itself was paid down by some $29 billion.
As a media headline writer noted recently, once again, the main
function of a home is returning to that of residence, not a resource to
pay for something else.
Finally,
though, this last quarter saw homeowners' equity go up. As
noted above, the value of real estate increased some $323
billion. Our measure of MEW declined by about $90 billion,
and mortgage debt itself was paid down by some $29 billion.
As a media headline writer noted recently, once again, the main
function of a home is returning to that of residence, not a resource to
pay for something else.
Separately in this flow-of-funds report, we were also struck by the magnitude of the federal government's borrowing, and just one small comparison will suffice to illustrate. In these data, it's the historical comparison available through the time series that helps put these things in perspective. It's easy to joke about "a trillion here and trillion there", but here's a new way to look at these numbers. In Q2, net new issues of Treasury securities were just under $339 billion. In this one three-month period, at a time of year when tax inflows usually mean the Treasury borrows little or even pays down on the debt, the Treasury borrowed more than it had in any whole year before 2003. And this latest quarter's new debt was in fact seasonally small: the prior three quarters had averaged $518 billion, easily larger than any whole year ever -- until 2008.
End of Year| Flow of Funds (Y/Y % Chg.) | % of Total Outstanding | 2Q '09 | 1Q '09 | End of Year | ||
|---|---|---|---|---|---|---|
| 2008 | 2007 | 2006 | ||||
| Total Credit Market Debt Outstanding | -- | 3.0 | 4.2 | 5.0 | 10.4 | 9.8 |
| Federal Government | 13.6% | 35.9 | 28.3 | 24.2 | 4.9 | 3.9 |
| Households | 25.9% | -1.2 | -0.7 | 0.3 | 6.6 | 10.0 |
| Nonfinancial Corporate Business | 13.8% | 2.9 | 4.4 | 5.3 | 14.2 | 8.4 |
| Nonfarm, Noncorporate Business | 6.9% | -1.7 | 1.4 | 4.9 | 12.6 | 14.7 |
| Financial Sectors | 31.3% | -0.9 | 3.7 | 5.5 | 13.4 | 9.9 |
| Trillions of $ | ||||||
| Net Worth: Households & Nonprofit Organizations | -- | $53.140 | $51.141 | $52.917 | $62.911 | $63.335 |
| Tangible Assets: Households | -- | $24.847 | $24.660 | $25.177 | $27.526 | $28.724 |
| Financial Assets: Households | -- | $42.361 | $40.584 | $41.957 | $50.703 | $48.025 |
| Total Liabilities: Households | -- | $14.068 | $14.103 | $14.217 | $14.318 | $13.414 |

Tom Moeller
AuthorMore in Author Profile »Prior to joining Haver Analytics in 2000, Mr. Moeller worked as the Economist at Chancellor Capital Management from 1985 to 1999. There, he developed comprehensive economic forecasts and interpreted economic data for equity and fixed income portfolio managers. Also at Chancellor, Mr. Moeller worked as an equity analyst and was responsible for researching and rating companies in the economically sensitive automobile and housing industries for investment in Chancellor’s equity portfolio. Prior to joining Chancellor, Mr. Moeller was an Economist at Citibank from 1979 to 1984. He also analyzed pricing behavior in the metals industry for the Council on Wage and Price Stability in Washington, D.C. In 1999, Mr. Moeller received the award for most accurate forecast from the Forecasters' Club of New York. From 1990 to 1992 he was President of the New York Association for Business Economists. Mr. Moeller earned an M.B.A. in Finance from Fordham University, where he graduated in 1987. He holds a Bachelor of Arts in Economics from George Washington University.
More Economy in Brief


