 Global| May 21 2009
U.S. Leading Indicators Improve Sharply To The Highest Level Since November
by:Tom Moeller
|in:Economy in Brief
Summary
Perhaps foreshadowing economic recovery was a report from the Conference Board showing that the April composite index of leading economic indicators jumped 1.0%. The rise recovered the declines during the prior several months and left [...]
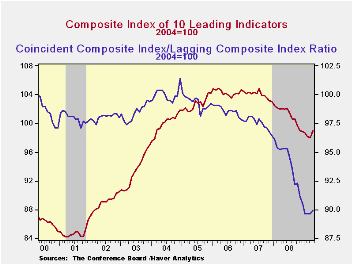
Perhaps foreshadowing economic recovery was a report from the Conference Board showing that the April composite index of leading economic indicators jumped 1.0%. The rise recovered the declines during the prior several months and left the index at its highest level since last November.
Nearly three quarters of the ten components of the leading index increased last month with the largest contributions coming from higher stock prices, improved consumer expectations and a more positively sloped interest rate yield curve.
The leading index is based on actual reports for eight
economic data series. The Conference Board initially estimates two
series, orders for consumer goods and orders for capital goods.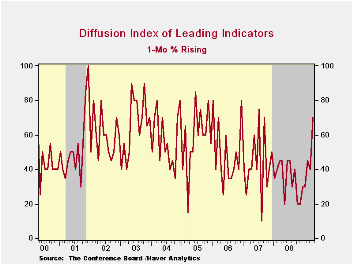
Suggesting that the rate of decline in the economy is slowing were the coincident indicators. They fell another 0.2% which was the smallest decline since last July. The negative contributions from lower employment and production eased. Half of the four component series rose during April led by gains in real disposable income and business sales. Over the last ten years there has been a 76% correlation between this y/y change and real GDP.
In a sign that excesses in the U.S. economy are diminishing, the lagging index fell for the fourth month in the last five. The ratio of coincident-to-lagging indicators (a measure of economic excess) rose modestly to the highest level this year.
The Conference Board figures are available in Haver's BCI database. Visit the Conference Board's site for coverage of leading indicator series from around the world.
| Business Cycle Indicators (%) | April | March | February | Jan. 6-Month % (AR) | 2008 | 2007 | 2006 |
|---|---|---|---|---|---|---|---|
| Leading | 1.0 | -0.2 | -0.5 | -1.2 | -2.8 | -0.3 | 1.5 |
| Coincident | -0.2 | -0.6 | -0.6 | -4.9 | -0.8 | 1.6 | 2.5 |
| Lagging | -0.5 | -0.5 | -0.6 | -1.9 | 2.9 | 2.8 | 3.3 |
by Tom Moeller May 21, 2009
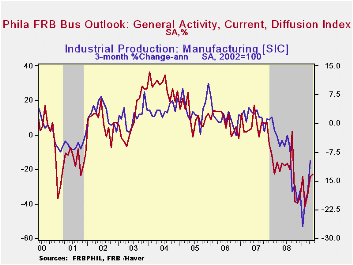
The Philadelphia Federal Reserve Bank indicated that economic activity in the region continued to contract during May but that the rate of decline slowed. The Index of General Business conditions in the manufacturing sector came in at -22.6 which was the least negative reading since last September. The latest figure, nonetheless, was weaker than an expected reading of -18.
Though the latest figure remained negative it indicates that the decline in economic activity is moderating. During the last ten years there has been a 77% correlation between the level of the Philadelphia Fed Business Conditions Index and the three-month growth in factory sector industrial production. There has been a 68% correlation with q/q growth in real GDP.
The Philadelphia Fed constructs a diffusion index for total business activity and each of the sub-indexes. The business conditions index reflects a separate survey question.
Amongst the sub-indexes shipments, inventories and unfilled
orders rose. The new orders index fell slightly, however, and has been
moving erratically sideways this year. Showing much improvement was the
employment index which rose significantly to the highest level since
last November. A reduced thirty-four percent of respondents expected to
lower employment levels and an improved eight percent expected to raise
them. During the last ten years there has been a 79% correlation
between the index level and the m/m change in manufacturing sector
payrolls.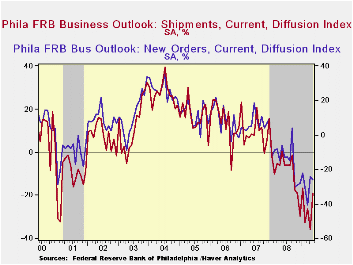
The prices paid index remained low at -22.8. Only one percent of respondents planned to raise prices while twenty-four percent expected to lower them. During the last ten years there has been a 74% correlation between the prices paid index and the three-month growth in the intermediate goods PPI. There has been an 83% correlation with the change in core intermediate goods prices.
The separate index of expected business conditions in six months improved to its highest level since 2004. The expectations index for new orders, shipments and employment surged.
The figures from the Philadelphia Federal Reserve can be found in Haver's SURVEYS database.
The latest Business Outlook Survey from the Federal Reserve Bank of Philadelphia can be found here.
| Philadelphia Fed (%) | May | April | May '08 | 2008 | 2007 | 2006 |
|---|---|---|---|---|---|---|
| General Activity Index | -22.6 | -24.4 | -16.3 | -21.3 | 5.0 | 8.0 |
| Prices Paid Index | -22.8 | -31.5 | 52.2 | 36.4 | 26.3 | 36.7 |
by Tom Moeller May 21, 2009
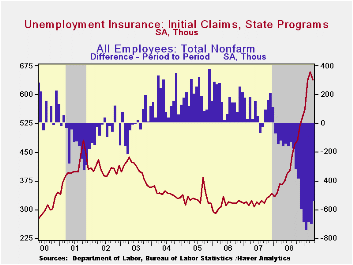
Job creation remains unambiguously weak even as the latest figures on U.S. initial claims gave another indication of tenuous improvement. Jobs weakness is evident in continuing claims for unemployment insurance, which provide an indication of workers' ability to find employment. Signaling greater inability to secure work, they increased to another record high of 6,662,000, more than twice the year ago level. The series dates back to 1966. Further indicating that the job market remains weak, the four-week average of continuing claims also rose to another record of 6,480,500.
The lack of hiring continued to push the insured unemployment rate higher to 5.0%. That level was more than double last April and the highest level since 1983. During the last ten years there has been a 93% correlation between the level of the insured unemployment rate and the overall rate of unemployment published by the Bureau of Labor Statistics.Clearly, the latest weekly figure understates labor market distress in some states. The highest insured unemployment rates in the week ending May 2 were in Oregon (7.4 percent), Michigan (6.9), Puerto Rico (6.6), Nevada (6.4), Pennsylvania (6.3), Wisconsin (6.2), Idaho (6.0), California (5.6), Alaska (5.5), New Jersey (5.4), and North Carolina (5.4).
A sign of tenuous improvement in the labor market was the fall
in initial claims for unemployment insurance, down a modest 12,000 to
631,000. That followed an upwardly revised gain during the prior week.
Though still relatively high, initial claims are down from their March
high of 674,000. The four-week average of claims, which smoothes out
some of the volatility in the weekly numbers, ticked down to 628,500,
still near the lowest level since mid-February. The Consensus
expectation was for 630,000 claims last week.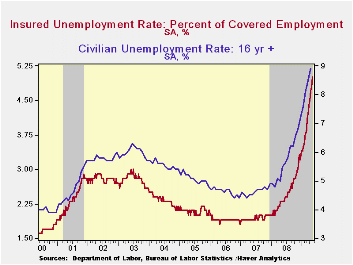
The Labor Department indicated that the largest increases in initial claims for the week ending May 9 were in Michigan (+16,817), North Carolina (+3,783), Virginia (+2,871), Kentucky (+2,768), and Pennsylvania (+2,444), while the largest decreases were in California (-10,052), Wisconsin (-1,691), Kansas (-1,415), Oklahoma (-1,084), and Washington (-843).
The latest initial claims figures cover the survey week for May nonfarm payrolls and claims fell 14,000 (-2.2%) from the April survey period. For April, a modest increase in initial claims was accompanied by a 539,000 decline in nonfarm payrolls. During the last ten tears there has been an 87% negative correlation between the level of initial claims and the change in nonfarm payrolls.
The unemployment insurance claims data is available in Haver's WEEKLY database.
The minutes from the latest meeting of the Federal Open Market Committee are available here.
| Unemployment Insurance (000s) | 05/16/09 | 05/09/09 | 05/02/09 | Y/Y | 2008 | 2007 | 2006 |
|---|---|---|---|---|---|---|---|
| Initial Claims | 631 | 643 | 605 | 68.7% | 420 | 321 | 313 |
| Continuing Claims | -- | 6,662 | 6,587 | 117.6% | 3,342 | 2,552 | 2,459 |
by Robert Brusca May 21, 2009
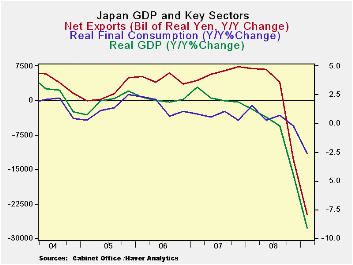
Japan is being lead lower by its trade dependence as much as
any large developed country. Exports are lower at a 70% annual rate Q/Q
and by 37% Yr/Yr. Imports meanwhile are dropping at a lesser but still
outsized 47% annual rate in q1 and are off by nearly 15% Yr/Yr.
Japan’s import to GDP ratio has fallen by 6.2% Yr/Yr less than
in the US where that ratio has fallen by a huge 14%. But exports are a
much larger part of Japan’s economy, so the drop has hurt it more.
Import-to-GDP ratios have fallen sharply among the large developed
economies in general.
Japan’s GDP drop at 15.2% Q/Q saar outstrips Germany’s drop of
14.4% and its Yr/Yr decline of 9.1% exceeds Germany’s 6.9%. It is no
coincidence that these large set backs -- the largest among G-7
countries by a long shot -- befall two of the most highly efficient
global economies that also are highly dependent on trade.
Trade tends to be a highly income elastic GDP component.
Export and import growth rates are pro-cyclical. In good times trade
dependence will help to pump-up GDP growth, but in bad times
–recessions - it will drag it down as it is now. In the US, since it is
a trade deficit county, the trade setback actually boosts GDP. What we
are seeing in Japan is the mirror image of that relationship.
In Japan domestic demand is down by less than GDP itself. But
housing and business capital formation are each down at a more rapid
pace than GDP. Japan will need world trade to recover before it can
mend its economy. Its economic structure means that some of its
required fixing it out of its control.
| Japan GDP | ||||||||||
|---|---|---|---|---|---|---|---|---|---|---|
| Consumption | Capital Formation | Trade Domestic | ||||||||
| GDP | Private | Public | Gross Fix Cap |
Plnt& Equip |
Housing | X-M: lbns E |
Exports | Imports | Demand | |
| % change Q/Q at annual rates of change; X-M is Q/Q change in Blns of real yen | ||||||||||
| Q1-09 | -15.2% | -4.2% | 1.3% | -27.5% | -35.5% | -20.0% | -11.2 | -70.1% | -47.7% | -9.8% |
| Q4-08 | -14.4% | -3.1% | 6.4% | -14.6% | -24.2% | 23.7% | -15.6 | -47.1% | 13.1% | -2.3% |
| Q3-08 | -2.5% | 0.4% | -0.7% | -9.7% | -16.4% | 13.2% | 0.0 | 4.0% | 6.3% | -2.3% |
| Q2-08 | -3.5% | -3.8% | -3.1% | -9.5% | -11.2% | -7.7% | 1.9 | -3.2% | -15.7% | -5.7% |
| % change Yr/Yr; X-M is Yr/Yr change in Gap in Blns of real yen | ||||||||||
| Q1-09 | -9.1% | -2.7% | 0.9% | -15.7% | -22.4% | 0.8% | -24.9 | -36.8% | -14.7% | -5.1% |
| Q4-08 | -4.5% | -0.2% | 0.2% | -7.8% | -12.0% | 11.8% | -13.1 | -12.5% | 2.8% | -1.8% |
| Q3-08 | -0.2% | 0.7% | 0.4% | -4.9% | -4.5% | -5.5% | 4.0 | 4.5% | 0.1% | -1.1% |
| Q2-08 | 0.6% | 0.3% | 0.1% | -3.6% | 0.5% | -16.5% | 6.7 | 6.3% | -2.1% | -0.8% |
| 5-Yrs | -0.4% | 0.5% | 1.2% | -2.8% | -0.7% | -3.5% | na | -2.6% | 0.2% | -0.1% |

Tom Moeller
AuthorMore in Author Profile »Prior to joining Haver Analytics in 2000, Mr. Moeller worked as the Economist at Chancellor Capital Management from 1985 to 1999. There, he developed comprehensive economic forecasts and interpreted economic data for equity and fixed income portfolio managers. Also at Chancellor, Mr. Moeller worked as an equity analyst and was responsible for researching and rating companies in the economically sensitive automobile and housing industries for investment in Chancellor’s equity portfolio. Prior to joining Chancellor, Mr. Moeller was an Economist at Citibank from 1979 to 1984. He also analyzed pricing behavior in the metals industry for the Council on Wage and Price Stability in Washington, D.C. In 1999, Mr. Moeller received the award for most accurate forecast from the Forecasters' Club of New York. From 1990 to 1992 he was President of the New York Association for Business Economists. Mr. Moeller earned an M.B.A. in Finance from Fordham University, where he graduated in 1987. He holds a Bachelor of Arts in Economics from George Washington University.
More Economy in Brief


