 Global| Dec 18 2020
U.S. Leading Indicators Continue to Rise During November
by:Tom Moeller
|in:Economy in Brief
Summary
• Rise in leading index moderates. • Gain in coincident indicators slows substantially. • Drop in lagging index suggests less economic stress. The Conference Board reported that its Composite Index of Leading Economic Indicators [...]
• Rise in leading index moderates.
• Gain in coincident indicators slows substantially.
• Drop in lagging index suggests less economic stress.
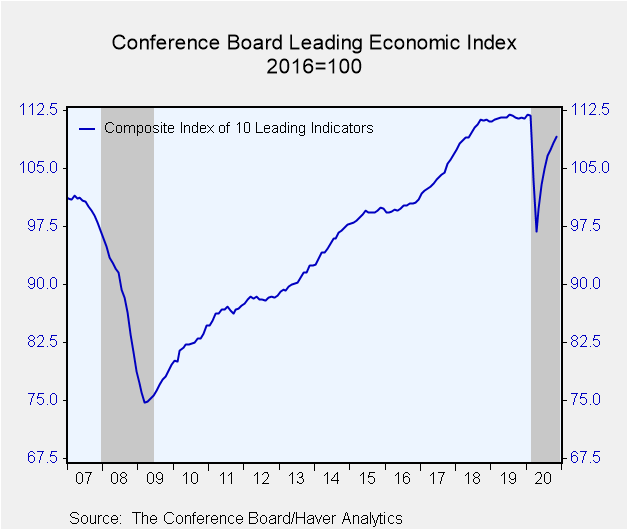
The Conference Board reported that its Composite Index of Leading Economic Indicators increased 0.6% (-2.2% y/y) during November after rising 0.8% in October, revised from 0.7%. It was the smallest increase of the economic recovery. The Leading Index is comprised of 10 components which tend to precede changes in overall economic activity. Seven of those components contributed positively to last month's increase, including fewer initial claims for jobless insurance, a higher ISM orders index, more building permits and higher stock prices. Two series declined including the length of the workweek and orders for nondefense capital goods excluding aircraft.
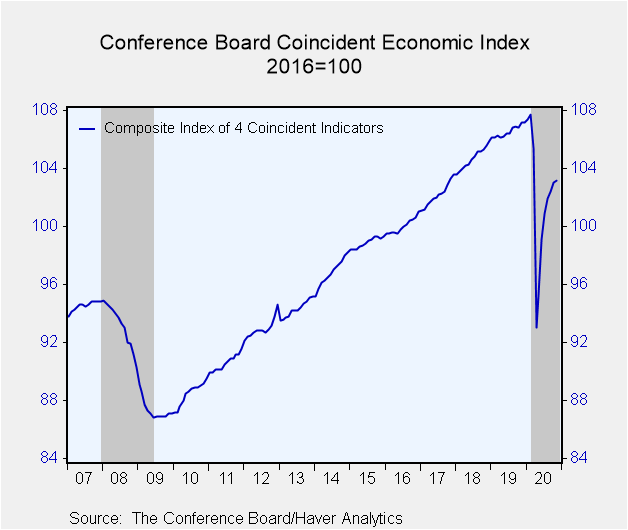
The rise in the Index of Coincident Economic Indicators decelerated sharply to 0.2% last month (-3.7% y/y) after increasing 0.6% in October, revised from 0.5%. Each of the four component series, including payroll employment, personal income less transfers, industrial production, and manufacturing & trade sales demonstrated lessened gains. The average 0.4% increase in the series during the last two months compares to an average 1.1% monthly rise in Q3.
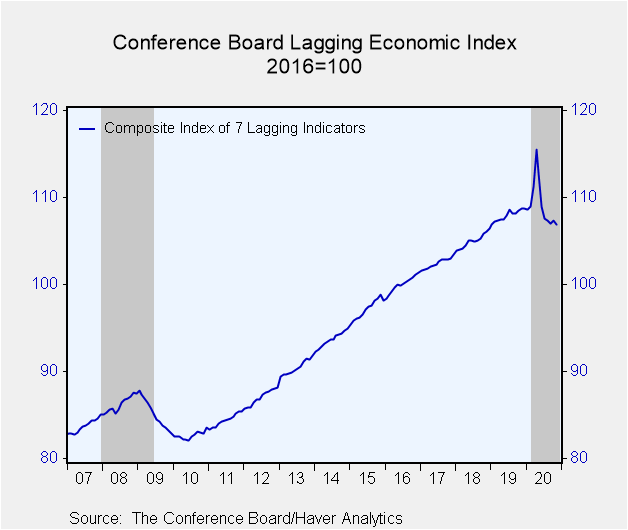
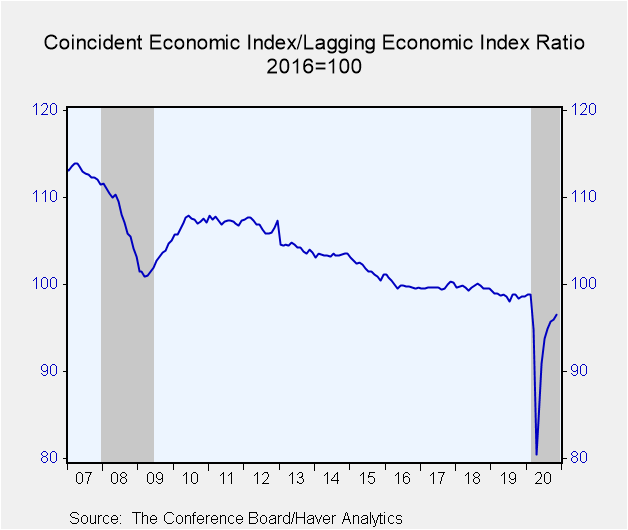
The Index of Lagging Economic Indicators fell 0.4%. The 1.7% y/y decline in the series is the softest reading since August 2010, suggesting a significant build-up of economic slack.
The Conference Board figures are available in Haver's BCI database; the components are available there, and most are also in USECON. The expectations are in the AS1REPNA database. Visit the Conference Board's site for coverage of leading indicator series from around the world.
| Business Cycle Indicators (%) | Nov | Oct | Sep | Nov Y/Y | 2019 | 2018 | 2017 |
|---|---|---|---|---|---|---|---|
| Leading | 0.6 | 0.8 | 0.7 | -2.2 | 1.6 | 5.7 | 3.9 |
| Coincident | 0.2 | 0.6 | 0.5 | -3.7 | 1.8 | 2.5 | 2.2 |
| Lagging | -0.4 | 0.3 | -0.4 | -1.7 | 2.8 | 2.5 | 2.4 |
Tom Moeller
AuthorMore in Author Profile »Prior to joining Haver Analytics in 2000, Mr. Moeller worked as the Economist at Chancellor Capital Management from 1985 to 1999. There, he developed comprehensive economic forecasts and interpreted economic data for equity and fixed income portfolio managers. Also at Chancellor, Mr. Moeller worked as an equity analyst and was responsible for researching and rating companies in the economically sensitive automobile and housing industries for investment in Chancellor’s equity portfolio. Prior to joining Chancellor, Mr. Moeller was an Economist at Citibank from 1979 to 1984. He also analyzed pricing behavior in the metals industry for the Council on Wage and Price Stability in Washington, D.C. In 1999, Mr. Moeller received the award for most accurate forecast from the Forecasters' Club of New York. From 1990 to 1992 he was President of the New York Association for Business Economists. Mr. Moeller earned an M.B.A. in Finance from Fordham University, where he graduated in 1987. He holds a Bachelor of Arts in Economics from George Washington University.


