 Global| Apr 17 2008
U.S. Leading Economic Indicators Up Slightly
by:Tom Moeller
|in:Economy in Brief
Summary
The composite index of leading economic indicators, reported by the Conference Board, increased 0.1% in March after an unrevised 0.3% February decline. It was the leaders' first increase in six months. During the last ten years there [...]
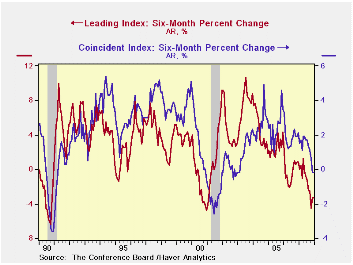
The composite index of leading economic indicators, reported by the Conference Board, increased 0.1% in March after an unrevised 0.3% February decline. It was the leaders' first increase in six months.
During the last ten years there has been a 59% correlation between the y/y change in the leading indicators index and the lagged change in real GDP.
The breadth of one month increase amongst the 10 components of the leading index improved to 60%. It was the first month over the break even level of 50% since last September. Over a six month period, however, the breadth of gain amongst the leaders components remained quite low at 30%.
Last month, a more positive yield spread between the 10 Year Treasury Bond and the Fed funds rate, stronger money supply growth and vendor performance made the largest positive contributions to the leading index. That was offset by lower stock prices, lower consumer expectations and higher claims for jobless insurance. 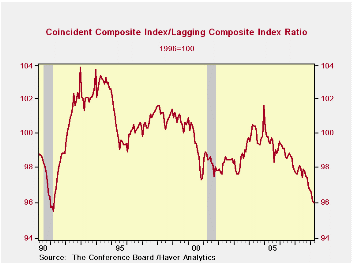
The method of calculating the contribution to the leading index from the spread between 10 year Treasury securities and the Fed funds rate has been revised. A negative contribution will now occur only when the spread inverts rather than when declining as in the past. More details can be found here.
The leading index is based on eight previously reported economic data series. Two series, orders for consumer goods and orders for capital goods, are estimated.
The coincident indicators rose 0.1% or the first gain in five months. Over the last ten years there has been an 86% correlation between the y/y change in the coincident indicators and real GDP growth. Half of the coincident series components fell.
The lagging index rose again as the average duration of unemployment rose. The ratio of coincident to lagging indicators (a measure of economic excess) fell yet again and was at its lowest since early 1991.Visit the Conference Board's site for coverage of leading indicator series from around the world.
| Business Cycle Indicators | March | February | Dec., 6 Month % (AR) | 2007 | 2006 | 2005 |
|---|---|---|---|---|---|---|
| Leading | 0.1% | -0.3% | -3.3% | -0.4% | 1.3% | 2.7% |
| Coincident | 0.1% | -0.2% | -0.2% | 1.7% | 2.4% | 2.5% |
| Lagging | 0.3% | 0.3% | 2.9% | 2.9% | 3.1% | 3.1% |
by Tom Moeller April 17, 2008
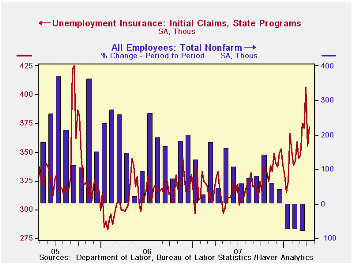
Initial unemployment insurance claims last week rose 17,000 to 372,000. During the prior week, claims fell 51,000 and that was slightly less of a decline than reported initially. Consensus expectations had been for claims to total 375,000 last week.
A claims level below 400,000 typically has been associated with growth in nonfarm payrolls. During the last ten years there has been a (negative) 76% correlation between the level of initial claims and the m/m change in nonfarm payroll employment.
The latest claims figure covers the week that April nonfarm payrolls were surveyed by the Labor Department and claims fell 3,000 (-0.8%) from the March survey period.
The four week moving average of initial claims held roughly steady at 376,000 (17.0% y/y), still near its highest level since 2005.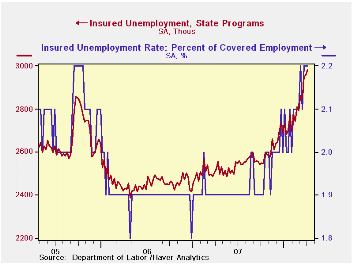
Continuing claims for unemployment insurance rose another 18,000 and the previous week's increase was revised up to 18,400. Insured unemployment was at its highest level since mid 2004. The figure provides some indication of workers' ability to find employment.
The continuing claims numbers lag the initial claims figures by one week.
The insured rate of unemployment held steady at 2.2% for the fourth week in the last five.
Yesterday's Senate testimony by Fed GovernorFrederic S. Mishkin, Small Business Lending, is available here.
The Federal Reserve's latest Beige Book covering regional economic conditions can be found here.
| Unemployment Insurance (000s) | 04/12/08 | 04/05/08 | Y/Y | 2007 | 2006 | 2005 |
|---|---|---|---|---|---|---|
| Initial Claims | 372 | 355 | 11.7% | 322 | 313 | 331 |
| Continuing Claims | -- | 2,984 | 18.4% | 2,552 | 2,459 | 2,662 |
by Tom Moeller April 17, 2008
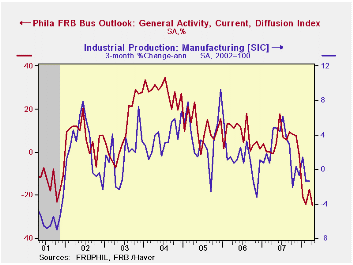
The Philadelphia Federal Reserve Bank reported that its April Index of General Business Conditions in the manufacturing sector fell to -24.9% and reversed all of the prior month's modest improvement. The latest level was the lowest since the recession year 2001.
The Philadelphia Fed constructs a diffusion index for total business activity and each of the sub indexes. The business conditions index reflects a separate survey question, not the sub indexes listed below.
During the last ten years there has been a 59% correlation between the level of the Philadelphia Fed Business Conditions Index and the three-month growth in factory sector industrial production. There has been a 42% correlation with q/q growth in real GDP.
Sharp declines in the new orders, employment and in the inventories sub indexes were registered while shipments fell modestly.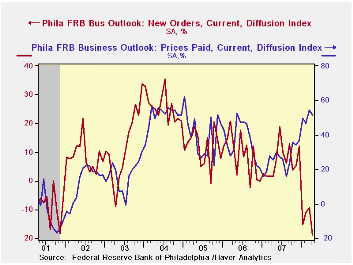
The prices paid index backed off slightly after rising in March to its highest level since January 2005. During the last ten years there has been a 76% correlation between the prices paid index and the three-month growth in the intermediate goods PPI. There has been an 85% correlation with the change in core intermediate goods prices.
The separate index of expected business conditions in six months rose sharply and was at the highest level since November; positive for the first month in the last three. Expectations for new orders rose sharply
The latest Business Outlook Survey from the Federal Reserve Bank of Philadelphia can be found here.
The Changing Business of Banking: Implications for Financial Stability and Lessons from Recent Market Turmoil is today's speech by Federal Reserve Vice Chairman Donald L. Cohn and it is available here.
The Economic Logic of a Fresh Start, which examines personal bankruptcy filings, from the Federal Reserve Bank of Philadelphia can be found here.
| Philadelphia Fed (%) | April | March | April '07 | 2007 | 2006 | 2005 |
|---|---|---|---|---|---|---|
| General Activity Index | -24.9 | -17.4 | -0.8 | 5.1 | 8.1 | 11.5 |
| Prices Paid Index | 51.6 | 54.4 | 27.6 | 26.4 | 36.6 | 40.1 |
by Tom Moeller April 17, 2008
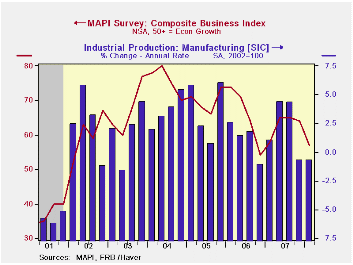
The 1Q '08 Composite Business Index published by the Manufacturers' Alliance/MAPI fell to 57 from 64 in 4Q '07. The latest reading was the lowest since 4Q '06.
During the last ten years there has been a 69% correlation between the Composite Index Level and quarterly growth in US factory sector output.
The current orders index fell sharply to the lowest since 2003. The 1Q export orders index also fell moderately to its lowest level since mid-2005. During the last ten years there has been a 59% correlation between the export orders index and quarterly growth in real US exports.
The profit margins index also fell to its lowest level since 3Q '05.Capital spending intentions for the coming year were down to the lowest level since 2006. During the last ten years there has been a 75% correlation between the capital spending index and q/q growth in business investment.
The survey of 60 senior financial executives representing a broad range of manufacturing industries reflects the views on current & future business conditions. The business outlook index is a weighted sum of shipments, backlogs, inventories, and profit margin indexes.
For the latest US Business Outlook from the MAPI click here.
| Manufacturers' Alliance/MAPI Survey | 1Q '08 | 4Q '07 | 1Q '07 | 2007 | 2006 | 2005 |
|---|---|---|---|---|---|---|
| Composite Business Index | 57 | 64 | 58 | 63 | 66 | 70 |
by Robert Brusca April 17, 2008
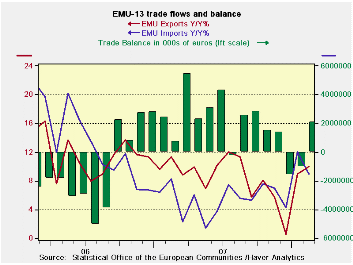
The Euro Area is not going to make it easy for us to understand it. After two months of deficits, the trade surplus is back. Imports fell across the board in February paving the way for the trade improvement. Both export and import flows have accelerated in recent months. But the year/year import picture is showing some softening. Meanwhile, exports, after looking for all the world like the strong euro value was getting to them toward the end of 2007, have rebounded sharply and put in two strong months of growth. Export growth exceeds import growth again in February (Yr/Yr) for the fist time since early in 2007.
These trends create a quandary about growth. The main research houses in Germany have cut German and EMU growth estimates for this year. But how much of this is financial uncertainty at work, and how much is due to the strong exchange rate? The institutes expect EMU exports to slow in 2008 and to slow further in 2009. Meanwhile, import volume is expected to slow slightly as well in 2008 and in 2009. The picture is still one of an expanding surplus because even though exports are projected to slow over the period they are continuing to outpace imports early in 2008 and will only lose out by small growth differentials in 2008 for the year as a whole and not enough to overwhelm the fact that exports already exceed imports. Exports will, however, slip relative to imports again in 2009, bringing a small deficit. While the strong euro seems to be having some impact it is not enough to bring persisting deficits to the e-Zone trade account until 2009. It makes you wonder how much pain the current euro exchange rate is causing and if it is proportional to the noise that is being made about it? The euro seems high. The trade weighted real euro exchange rate is extremely high. And Europe is quite trade-dependent. So why is the euro’s strength having such a small impact on trade? That remains a conundrum. The Euro reached a record high Vs the dollar and real trade-weighted high in late 2007 yet even by end 2009 the impact on trade is expected to be muted.
| m/m% | % Saar | |||||
| Feb-08 | Jan-08 | 3M | 6M | 12M | 12M Ago | |
| Balance* | €€ 2,103 | €€ (1,048) | €€ (178) | €€ 876 | €€ 1,888 | €€ (569) |
| Exports | ||||||
| All Exp | 2.0% | 6.8% | 23.5% | 10.4% | 10.0% | 11.4% |
| Food and Drinks | -1.7% | 3.4% | -2.5% | -0.5% | 5.4% | 10.8% |
| Raw materials | 1.0% | 6.4% | 28.3% | 12.0% | 13.2% | 5.2% |
| Other | 2.2% | 7.0% | 25.2% | 11.1% | 10.3% | 11.5% |
| MFG | 0.3% | 6.6% | 7.9% | 1.6% | 6.6% | 10.1% |
| IMPORTS | ||||||
| All IMP | -0.4% | 6.3% | 21.1% | 11.4% | 9.0% | 8.3% |
| Food and Drinks | -2.1% | 2.8% | -4.4% | 7.1% | 9.1% | 11.4% |
| Raw materials | -1.3% | 1.5% | 5.0% | -4.7% | -1.1% | 24.5% |
| Other | -0.3% | 6.8% | 23.8% | 12.6% | 9.5% | 7.3% |
| MFG | -2.8% | 4.6% | -1.5% | -8.6% | -2.5% | 12.8% |
| *Millions of Euros; mo or period average | ||||||
by Robert Brusca April 17, 2008
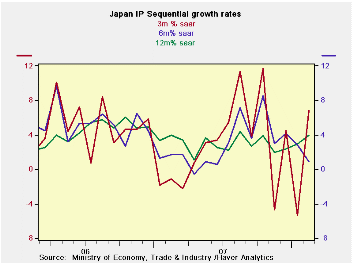
Japan's February industrial production was revised up sharply using a new data formula. Production is now in line with Japan’s strong exports, solving one of the puzzles about the economy for the Bank of Japan. Industrial production rose 1.6% in February from January, revised up significantly in a turnaround from the initial estimate of a 1.2% fall that was reported last month. The revision was due mainly to a change in data calculation methods rather than to revised data themselves. From a year earlier, February production rose 5.1% after gaining 2.2% in January. Still, for manufacturing sequential growth rates do not paint a clear picture. The revision has elevated the three-month growth rates to strong levels. But, even with the new readings, over six months there is a lull in growth compared to the 12-month pace. This finding is across the board in manufacturing; utilities output has a stronger more consistent trend. It is thus too soon to say that the revival discovered though data revision is what it seems. Several more months of data should help to clarify the nature of the trend.
| m/m % | Saar % | Yr/Yr | |||||
| seasonally adjusted | Feb-08 | Jan-08 | Dec-07 | 3-mo | 6-mo | 12-mo | Yr-Ago |
| Mining & Manufacturing | 1.6% | -0.5% | 0.6% | 6.8% | 0.9% | 4.0% | 4.0% |
| Total Industry | 2.0% | -0.5% | 0.5% | 8.4% | 1.6% | 4.4% | 3.9% |
| Manufacturing | 1.6% | -0.6% | 0.7% | 6.8% | 0.9% | 4.0% | 4.0% |
| Textiles | -0.2% | -2.3% | 1.6% | -4.0% | -6.3% | -6.0% | -3.6% |
| Transport Eqpt | 1.3% | 1.8% | 1.3% | 18.9% | 5.4% | 11.4% | 6.7% |
| Product Group | |||||||
| Consumer Goods | 2.7% | 0.2% | 0.9% | 16.4% | 1.8% | 6.9% | 3.2% |
| Intermediate Goods | 1.0% | -1.9% | 1.1% | 0.7% | 2.0% | 4.0% | 4.6% |
| Investment Goods | 1.1% | 0.5% | 0.0% | 6.4% | -2.6% | -0.5% | 4.6% |
| Mining | 2.3% | -6.7% | -1.6% | -22.0% | -5.7% | -4.5% | 4.8% |
| Electricity & Gas | 9.7% | 0.1% | -1.2% | 38.7% | 17.4% | 17.5% | -1.4% |

Tom Moeller
AuthorMore in Author Profile »Prior to joining Haver Analytics in 2000, Mr. Moeller worked as the Economist at Chancellor Capital Management from 1985 to 1999. There, he developed comprehensive economic forecasts and interpreted economic data for equity and fixed income portfolio managers. Also at Chancellor, Mr. Moeller worked as an equity analyst and was responsible for researching and rating companies in the economically sensitive automobile and housing industries for investment in Chancellor’s equity portfolio. Prior to joining Chancellor, Mr. Moeller was an Economist at Citibank from 1979 to 1984. He also analyzed pricing behavior in the metals industry for the Council on Wage and Price Stability in Washington, D.C. In 1999, Mr. Moeller received the award for most accurate forecast from the Forecasters' Club of New York. From 1990 to 1992 he was President of the New York Association for Business Economists. Mr. Moeller earned an M.B.A. in Finance from Fordham University, where he graduated in 1987. He holds a Bachelor of Arts in Economics from George Washington University.
More Economy in Brief


