Global| Jun 22 2007
U.S. Leading Economic Indicators Up for Second Time This Year
by:Tom Moeller
|in:Economy in Brief
Summary
The composite index of leading economic indicators rose an expected 0.3% last month and fully recouped a 0.3% decline during April. The May gain was only the second monthly increase this year, according to the Conference Board and [...]
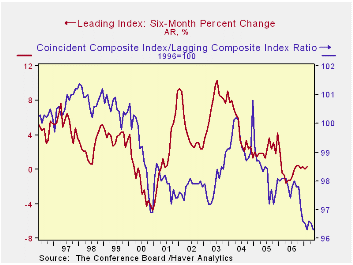
The composite index of leading economic indicators rose an expected 0.3% last month and fully recouped a 0.3% decline during April. The May gain was only the second monthly increase this year, according to the Conference Board and left the leaders up just 0.3% y/y.
During the last ten years there has been a 59% correlation between the y/y change in the leading indicators and the lagged change in real GDP.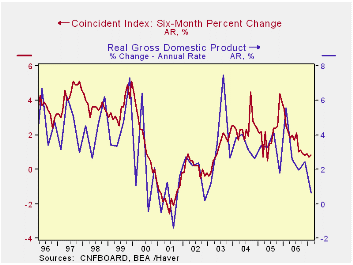
The breadth of one month gain amongst the 10 components of the leading index remained at a low 55% after a 30% rise amongst the leaders’ components’ during April.
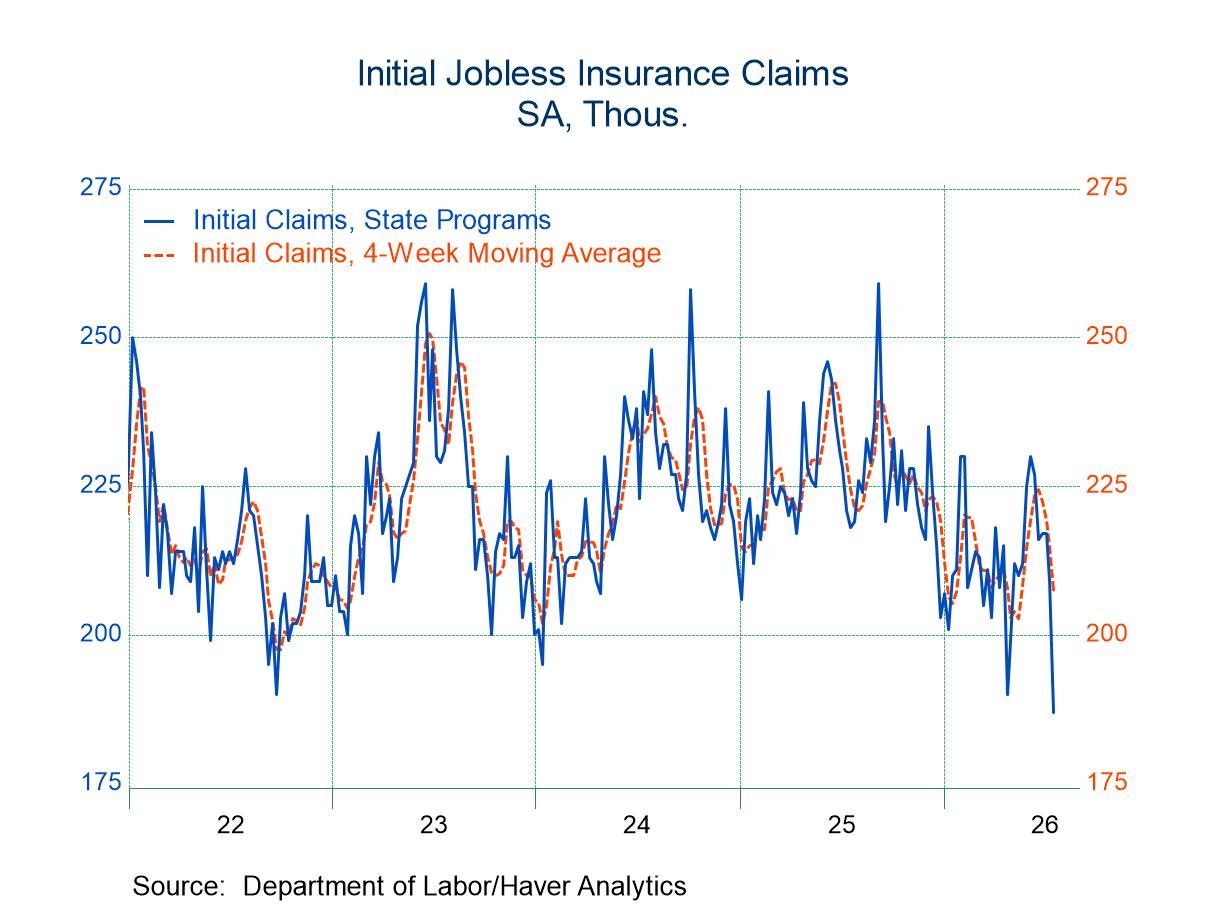
Lower initial claims for unemployment insurance, higher building permits and higher stock prices accounted for most of the gain in the leading index last month. Capital goods orders and the money supply fell.
The method of calculating the contribution to the leading index from the spread between 10 year Treasury securities and the Fed funds rate has been revised. A negative contribution will now occur only when the spread inverts rather than when declining as in the past. More details can be found here. 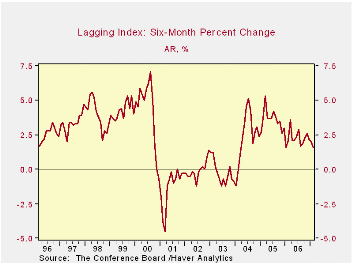
The leading index is based on eight previously reported economic data series. Two series, orders for consumer goods and orders for capital goods, are estimated.
The coincident indicators increased 0.2% after a 0.1% rise during May. Over the last ten years there has been a 91% correlation between the y/y change in the coincident indicators and real GDP growth.
The lagging index rose the same 0.2% as during May. As a result the ratio of coincident to lagging indicators (a measure of economic excess) fell during May following a slight decline the prior month.Visit the Conference Board's site for coverage of leading indicator series from around the world.
| Business Cycle Indicators | May | April | Y/Y | 2006 | 2005 | 2004 |
|---|---|---|---|---|---|---|
| Leading | 0.3% | -0.3% | 0.3% | 1.2% | 2.5% | 7.1% |
| Coincident | 0.2% | 0.1% | 1.8% | 2.5% | 2.1% | 2.0% |
| Lagging | 0.2% | 0.2% | 3.2% | 3.0% | 3.5% | 0.6% |

Tom Moeller
AuthorMore in Author Profile »Prior to joining Haver Analytics in 2000, Mr. Moeller worked as the Economist at Chancellor Capital Management from 1985 to 1999. There, he developed comprehensive economic forecasts and interpreted economic data for equity and fixed income portfolio managers. Also at Chancellor, Mr. Moeller worked as an equity analyst and was responsible for researching and rating companies in the economically sensitive automobile and housing industries for investment in Chancellor’s equity portfolio. Prior to joining Chancellor, Mr. Moeller was an Economist at Citibank from 1979 to 1984. He also analyzed pricing behavior in the metals industry for the Council on Wage and Price Stability in Washington, D.C. In 1999, Mr. Moeller received the award for most accurate forecast from the Forecasters' Club of New York. From 1990 to 1992 he was President of the New York Association for Business Economists. Mr. Moeller earned an M.B.A. in Finance from Fordham University, where he graduated in 1987. He holds a Bachelor of Arts in Economics from George Washington University.
More Economy in Brief