 Global| Feb 21 2006
U.S. Leading Economic Indicators Rose
by:Tom Moeller
|in:Economy in Brief
Summary
The composite index of leading economic indicators ticked up 0.1% last month after an upwardly revised 0.6% gain during December which was initially pegged at 0.3%, according to the Conference Board. The uptick fell short of Consensus [...]
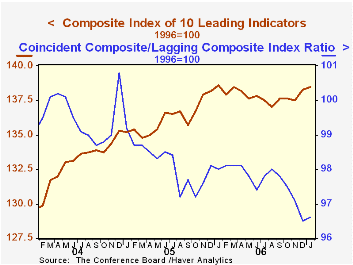
The composite index of leading economic indicators ticked up 0.1% last month after an upwardly revised 0.6% gain during December which was initially pegged at 0.3%, according to the Conference Board. The uptick fell short of Consensus expectations for a 0.2% increase.
During the last ten years there has been a 59% correlation between the y/y change in the leading indicators and the lagged change in real GDP.
The breadth of one month gain amongst the 10 components of the leading index backed off to 40% from the sharply improved 75% during December and over the last six months only 40% of the component series rose.
Lower initial claims for unemployment insurance, higher consumer expectations and a higher money supply offset negative contributions from most of the other leading indicator series.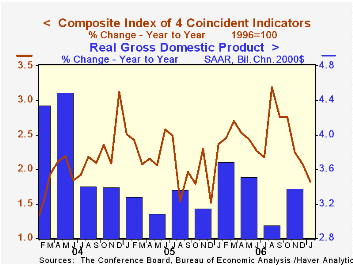
The method of calculating the contribution to the leading index from the spread between 10 year Treasury securities and the Fed funds rate has been revised. A negative contribution will now occur only when the spread inverts rather than when declining as in the past. More details can be found here.
The leading index is based on eight previously reported economic data series. Two series, orders for consumer goods and orders for capital goods, are estimated.
The coincident indicators increased 0.1% after the upwardly revised 0.2% rise. Over the last ten years there has been a 91% correlation between the y/y change in the coincident indicators and real GDP growth.
The lagging index fell 0.1% after strong gains during the prior three months. That prompted a rise in the ratio of coincident to lagging indicators (a measure of economic excess) for the first time in five months.
Visit the Conference Board's site for coverage of leading indicator series from around the world.
| Business Cycle Indicators | January | December | Y/Y | 2006 | 2005 | 2004 |
|---|---|---|---|---|---|---|
| Leading | 0.1% | 0.6% | -0.1% | 1.2% | 2.5% | 7.1% |
| Coincident | 0.1% | 0.2% | 1.8% | 2.5% | 2.1% | 2.0% |
by Tom Moeller February 21, 2007
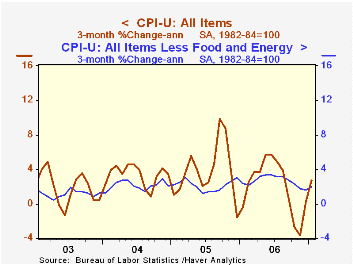
The consumer price index (CPI-U) rose 0.2% last month. The gain was half the 0.4% increase in December but it greatly exceeded Consensus expectations for no change.
A firm gain in core prices was behind the strength. Prices less food & energy rose 0.3% following three consecutive months of 0.1% increase. Consensus expectations had been for a lesser 0.2% increase.
Core goods prices posted a 0.1% (-0.2% y/y) increase which was the firmest gain since August. The rise was powered by a 3.1% (5.5% y/y) spike in tobacco prices. Apparel prices also rose a relatively firm 0.3% (1.0% y/y) which was the strongest gain since September. Many other goods prices, however, fell. Household furnishings & operations prices fell 0.3% (+0.5% y/y). New & used motor vehicles prices fell 0.2% (-1.4% y/y), down for the sixth straight month but medical care commodities rose 0.6% (2.2% y/y).
Core services prices rose 0.3% as shelter prices increased 0.3% (4.3% y/y) for the second month reflecting a mild 0.2% (4.3% y/y) gain in owner's equivalent rent, the weakest monthly increase in a year. Medical services prices jumped 0.9% (4.9% y/y) but education prices increased just 0.1% (5.8% y/y). Prices for public transportation surged 1.5% (0.7% y/y), the most for any one month since 2004.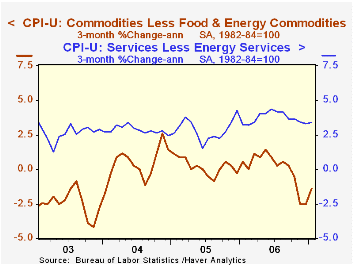
Energy prices fell 1.5% (-2.9% y/y) as gasoline prices slipped 3.0% (-2.7% y/y) and heating oil prices dropped 4.4% (-0.7% y/y). Piped gas & electricity prices, however, rose 0.5% (-3.4% y/y).
Food & beverage prices posted a strong 0.7% increase as dairy & related products surged 1.3% (-0.2% y/y) and meats, poultry & fish rose 0.8%% (2.1% y/y).
The chained CPI, which adjusts for shifts in the mix of consumer purchases, rose 0.3% and the chained "core" rose the same 0.3%.
Milton Friedman on Inflation from the Federal Reserve Bank of St. Louis can be found here.
| Consumer Price Index | January | December | Y/Y | 2006 | 2005 | 2004 |
|---|---|---|---|---|---|---|
| Total | 0.2% | 0.4% | 2.1% | 3.2% | 3.4% | 2.7% |
| Total less Food & Energy | 0.3% | 0.1% | 2.7% | 2.5% | 2.2% | 1.8% |
| Goods less Food & Energy | 0.1% | 0.0% | -0.2% | 0.2% | 0.5% | -0.9% |
| Services less Energy | 0.3% | 0.2% | 3.8% | 3.4% | 2.8% | 2.8% |
| Energy | -1.5% | 4.2% | -2.9% | 11.1% | 16.9% | 10.8% |
| Food & Beverages | 0.7% | -0.1% | 2.4% | 2.3% | 2.4% | 3.4% |
| Chained CPI: Total (NSA) | 0.3% | 0.1% | 1.9% | 2.9% | 2.9% | 2.5% |
| Total less Food & Energy | 0.3% | -0.2% | 2.3% | 2.3% | 1.9% | 1.7% |
by Tom Moeller February 21 2007
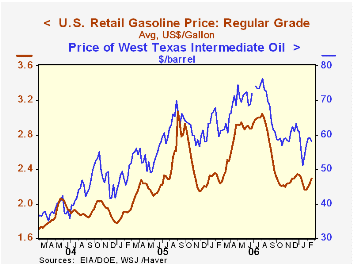
The latest Short-Term Energy Outlook from the U.S. Energy Information Administration is available here.
| Weekly Energy Prices | 02/19/07 | 02/12/07 | Y/Y | 2006 | 2005 | 2004 |
|---|---|---|---|---|---|---|
| US Retail Gasoline Price, Regular | $2.30 | $2.24 | 2.5% | $2.57 | $2.27 | $1.85 |
by Tom Moeller February 21, 2007
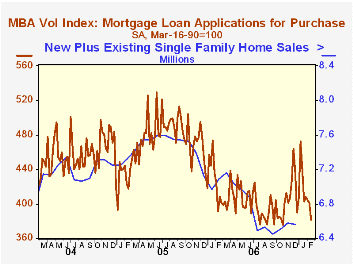
The total number of mortgage applications dropped 5.2%% last week to the lowest level since the last week in December, according to the Mortgage Bankers Association.
Purchase applications dropped 4.8% for the fifth down week in the last six.
During the last ten years there has been a 58% correlation between the y/y change in purchase applications and the change in new plus existing single family home sales.
Applications to refinance fell 5.4% for the first down week in a month.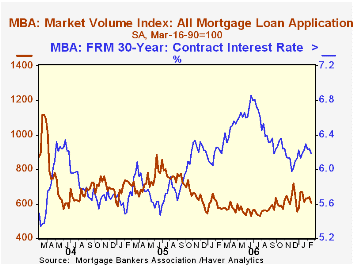
The effective interest rate on a conventional 30-year mortgage fell nine basis points to 6.37%. Rates averaged 6.40% last month and 6.28% in December. The peak for 30 year financing was 7.08% late in June. Rates for 15-year financing also fell to 6.14%, the lowest in a month. Interest rates on 15 and 30 year mortgages are closely correlated (>90%) with the rate on 10 year Treasury securities.
During the last ten years there has been a (negative) 79% correlation between the level of applications for purchase and the effective interest rate on a 30-year mortgage.
The Mortgage Bankers Association surveys between 20 to 35 of the top lenders in the U.S. housing industry to derive its refinance, purchase and market indexes. The weekly survey covers roughly 50% of all U.S. residential mortgage applications processed each week by mortgage banks, commercial banks and thrifts. Visit the Mortgage Bankers Association site here.
| MBA Mortgage Applications (3/16/90=100) | 02/16/07 | 02/09/07 | Y/Y | 2006 | 2005 | 2004 |
|---|---|---|---|---|---|---|
| Total Market Index | 606.6 | 639.8 | 4.9% | 584.2 | 708.6 | 735.1 |
| Purchase | 381.4 | 400.7 | -6.7% | 406.9 | 470.9 | 454.5 |
| Refinancing | 1,921.1 | 2,031.7 | 22.3% | 1,634.0 | 2,092.3 | 2,366.8 |
by Tom Moeller February 21, 2007
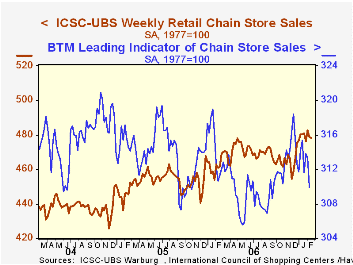
The ICSC-UBS retail chain-store sales index is constructed using the same-store sales (stores open for one year) reported by 78 stores of seven retailers: Dayton Hudson, Federated, Kmart, May, J.C. Penney, Sears and Wal-Mart.
The leading indicator of chain store sales from ICSC-UBS fell sharply for the third week in the last four, by 1.1% (-0.2% y/y).
| ICSC-UBS (SA, 1977=100) | 2/17/07 | 2/10/06 | Y/Y | 2006 | 2005 | 2004 |
|---|---|---|---|---|---|---|
| Total Weekly Chain Store Sales | 478.1 | 478.7 | 3.5% | 3.3% | 3.6% | 4.7% |

Tom Moeller
AuthorMore in Author Profile »Prior to joining Haver Analytics in 2000, Mr. Moeller worked as the Economist at Chancellor Capital Management from 1985 to 1999. There, he developed comprehensive economic forecasts and interpreted economic data for equity and fixed income portfolio managers. Also at Chancellor, Mr. Moeller worked as an equity analyst and was responsible for researching and rating companies in the economically sensitive automobile and housing industries for investment in Chancellor’s equity portfolio. Prior to joining Chancellor, Mr. Moeller was an Economist at Citibank from 1979 to 1984. He also analyzed pricing behavior in the metals industry for the Council on Wage and Price Stability in Washington, D.C. In 1999, Mr. Moeller received the award for most accurate forecast from the Forecasters' Club of New York. From 1990 to 1992 he was President of the New York Association for Business Economists. Mr. Moeller earned an M.B.A. in Finance from Fordham University, where he graduated in 1987. He holds a Bachelor of Arts in Economics from George Washington University.
More Economy in Brief


