 Global| Jan 18 2008
U.S. Leading Economic Indicators Down Again
by:Tom Moeller
|in:Economy in Brief
Summary
The Conference Board reported that the December composite index of leading economic indicators fell 0.2% after an unrevised 0.4% decline during November. A 0.1% decline had been expected. For all of last year the leaders fell 0.2% and [...]
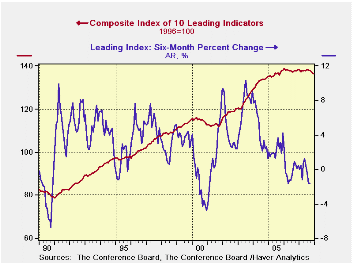
The Conference Board reported that the December composite index of leading economic indicators fell 0.2% after an unrevised 0.4% decline during November. A 0.1% decline had been expected.
For all of last year the leaders fell 0.2% and their six month growth rate, which is calculated as the latest month's reading divided by the average of the prior twelve months, stood at -1.6%. That was equal to the lowest level since 2001.
During the last ten years there has been a 59% correlation between the y/y change in the leading indicators index and the lagged change in real GDP.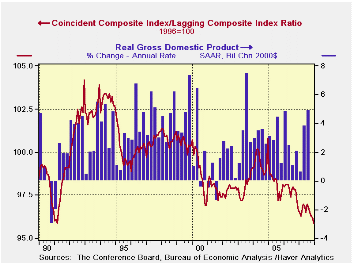
The breadth of one month gain amongst the 10 components of the leading index rose slightly to a still low 40.0%. Over a six month period, the breadth of gain amongst the leaders components was 30%, equal to its lowest level since 2002.
Last month unemployment insurance claims, stock prices, and consumer expectations made the largest contributions to the decline in the overall leading index.
The method of calculating the contribution to the leading index from the spread between 10 year Treasury securities and the Fed funds rate has been revised. A negative contribution will now occur only when the spread inverts rather than when declining as in the past. More details can be found here.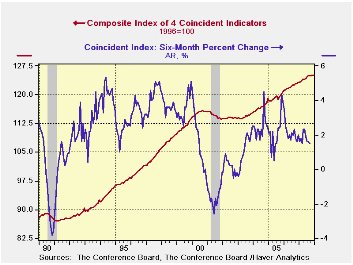
The leading index is based on eight previously reported economic data series. Two series, orders for consumer goods and orders for capital goods, are estimated.
The coincident indicators rose 0.1% after a downwardly revised 0.1% November uptick. Over the last ten years there has been an 86% correlation between the y/y change in the coincident indicators and real GDP growth. Three of the four coincident series components rose very slightly and the gains were offset by a decline in real income.
The lagging index rose 0.4% and continued its steady rise. Last month the gain was due to a longer duration of unemployment. The ratio of coincident to lagging indicators (a measure of economic excess) fell during nine months last year to the lowest level since 1991.Visit the Conference Board's site for coverage of leading indicator series from around the world.
Signal or Noise? Implications of the Term Premium for Recession Forecasting from the Federal Reserve Bank of New York can be found here.
| Business Cycle Indicators | December | November | Y/Y | 2007 | 2006 | 2005 |
|---|---|---|---|---|---|---|
| Leading | -0.2% | -0.4% | -1.4% | -0.2% | 1.2% | 2.5% |
| Coincident | 0.1% | 0.1% | 1.5% | 1.8% | 2.5% | 2.1% |
| Lagging | 0.4% | 0.2% | 2.3% | 3.0% | 3.0% | 3.5% |

Tom Moeller
AuthorMore in Author Profile »Prior to joining Haver Analytics in 2000, Mr. Moeller worked as the Economist at Chancellor Capital Management from 1985 to 1999. There, he developed comprehensive economic forecasts and interpreted economic data for equity and fixed income portfolio managers. Also at Chancellor, Mr. Moeller worked as an equity analyst and was responsible for researching and rating companies in the economically sensitive automobile and housing industries for investment in Chancellor’s equity portfolio. Prior to joining Chancellor, Mr. Moeller was an Economist at Citibank from 1979 to 1984. He also analyzed pricing behavior in the metals industry for the Council on Wage and Price Stability in Washington, D.C. In 1999, Mr. Moeller received the award for most accurate forecast from the Forecasters' Club of New York. From 1990 to 1992 he was President of the New York Association for Business Economists. Mr. Moeller earned an M.B.A. in Finance from Fordham University, where he graduated in 1987. He holds a Bachelor of Arts in Economics from George Washington University.
More Economy in Brief


