 Global| Jul 11 2008
U.S. June Budget Surplus Up, FYTD Deficit More Than Doubled
by:Tom Moeller
|in:Economy in Brief
Summary
The U.S. government ran a budget surplus in June, as it usually does, of $50.7B. In fact, the surplus was double the size it was during the past several years. Based on expectations formed by Public Debt Transactions from the Daily [...]
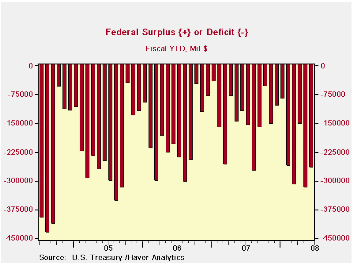
The U.S. government ran a budget surplus in June, as it usually does, of $50.7B. In fact, the surplus was double the size it was during the past several years. Based on expectations formed by Public Debt Transactions from the Daily Treasury Statement, the budget surplus beat the Consensus forecast for a $30.0B surplus. These transactions data are available in Haver's DAILY database.
That, however, is where the good news on the Federal budget front ends. For the first nine months of FY08 the government ran a budget deficit of $268.7B which was more than double the deficit during the first nine months of FY07.
For the fiscal year to date federal receipts fell 0.6% from a year earlier, the first negative comparison since 2003 and it compared to 7.5% y/y growth during the first nine months of FY07. Higher unemployment pulled the growth in individual income tax receipts (44% of total receipts) to a negative 0.8% this year versus 11.5% growth in FY07. Growth in withheld income taxes of 4.8% was roughly half that of a year earlier and non-withheld taxes grew 5.2%, or nearly one third as during the first nine months of FY07.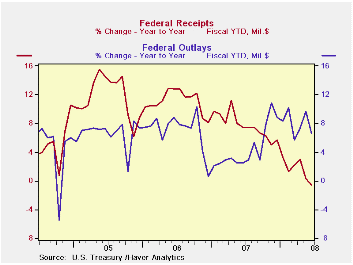
Lower corporate profitability provided a further crimp to government revenues. Corporate income taxes (13% of total receipts) declined 7.5% decline from receipts during the first nine months of FY07. During FY07 they rose 10.0% during the first nine months.
Unemployment insurance contributions fell 2.5% FYTD due to negative employment growth but Federal excise taxes rose 5.8%. Estate and gift taxes rose 13.6%.
U.S. net outlays grew 6.6% during the first nine months of FY08. That growth was more than double the outlay growth of FY07's first nine months. Growth in defense spending (19% of total outlays) led the doubling with a 10.1% gain while growth in transportation spending surged to 7.5% from 1.8% in FY07's first nine months.
Medicare expenditures (12% of outlays) actually fell 1.8% but health spending (10% of total outlays) held constant at a 5.4% growth rate. Growth in Social Security spending (21% of outlays) also held steady at 5.3% while growth in interest expense also held steady at 4.3%. Growth in outlays for income security (15% of outlays) surged to 17.5% from 4.4%.
The Government's financial data is available in Haver's USECON database.
| US Government Finance | June | May | Y/Y | FY 2007 | FY 2006 | FY 2005 |
|---|---|---|---|---|---|---|
| Budget Balance | $50.73B | -$165.9B | $27.5B (6/07) | -$162.0B | -$248.2B | -$318.7B |
| Net Revenues | $259.9 | $124.3B | -6.0% | 6.7% | 11.8% | 14.1% |
| Net Outlays | $209.2 | $290.2B | -16.0% | 2.8% | 7.4% | 7.6% |

Tom Moeller
AuthorMore in Author Profile »Prior to joining Haver Analytics in 2000, Mr. Moeller worked as the Economist at Chancellor Capital Management from 1985 to 1999. There, he developed comprehensive economic forecasts and interpreted economic data for equity and fixed income portfolio managers. Also at Chancellor, Mr. Moeller worked as an equity analyst and was responsible for researching and rating companies in the economically sensitive automobile and housing industries for investment in Chancellor’s equity portfolio. Prior to joining Chancellor, Mr. Moeller was an Economist at Citibank from 1979 to 1984. He also analyzed pricing behavior in the metals industry for the Council on Wage and Price Stability in Washington, D.C. In 1999, Mr. Moeller received the award for most accurate forecast from the Forecasters' Club of New York. From 1990 to 1992 he was President of the New York Association for Business Economists. Mr. Moeller earned an M.B.A. in Finance from Fordham University, where he graduated in 1987. He holds a Bachelor of Arts in Economics from George Washington University.
More Economy in Brief


