 Global| Sep 09 2020
U.S. JOLTS: Job Opportunities Increase but Hiring Lags
by:Tom Moeller
|in:Economy in Brief
Summary
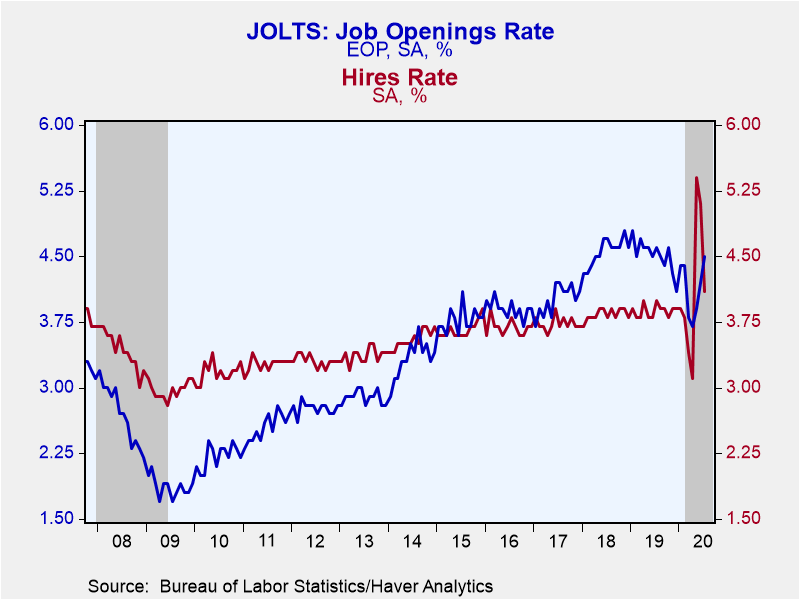
• Job openings become more available. • Hiring slows. • Layoffs ease while quits rise. The Bureau of Labor Statistics reported that the total job openings rate rose to 4.5% during July, the highest level since last October and up from [...]
• Job openings become more available.
• Hiring slows.
• Layoffs ease while quits rise.
The Bureau of Labor Statistics reported that the total job openings rate rose to 4.5% during July, the highest level since last October and up from April's low of 3.7%. The openings rate is calculated as job openings as a percent of total employment plus jobs that have not yet been filled. July's figures remained below the 4.8% record in January 2019. The hiring rate declined to 4.1% after surging to a record 5.4% in May. The overall layoff and discharge rate fell to 1.2% after leveling in May and June at 1.4% versus 5.9% in April. The quits rate rose to 2.1%, a five-month high. It nevertheless remained below the record 2.4% in July of last year. These figures date back to December 2000.
As of the last business day of July, the job openings level rose to 6.618 million, down 8.5% y/y. The job openings level in the construction sector fell 5.4% y/y and in manufacturing by 14.5% y/y. It fell by 20.6% y/y in leisure & hospitality and by 6.8% y/y in the professional & business service sector. In government, the number of job openings declined 5.1% y/y.
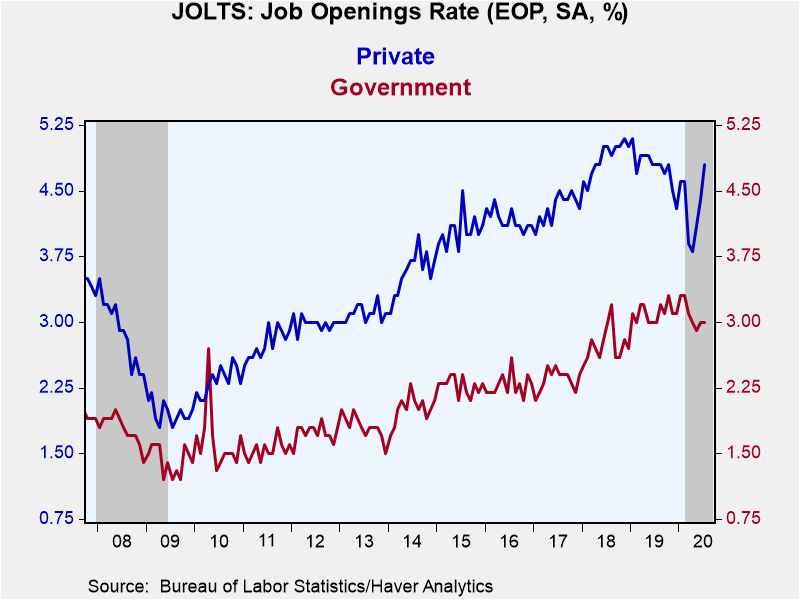
The private-sector job openings rate rose to 4.8%, slightly below the record rate of 5.1% reached in January 2019. The construction sector's job openings rate increased m/m to 4.4% but remained below 5.4% at its peak in April 2019. The rate in manufacturing surged m/m to 3.3%, the highest level since September 2019. The rate in leisure & hospitality fell to 5.7% from the record 6.6% in June but the rate in professional & business services improved to 5.7%, a five-month high. The government sector job openings rate held at 3.0%, up slightly from its May low of 2.9% but remained lower than the February record of 3.3%.
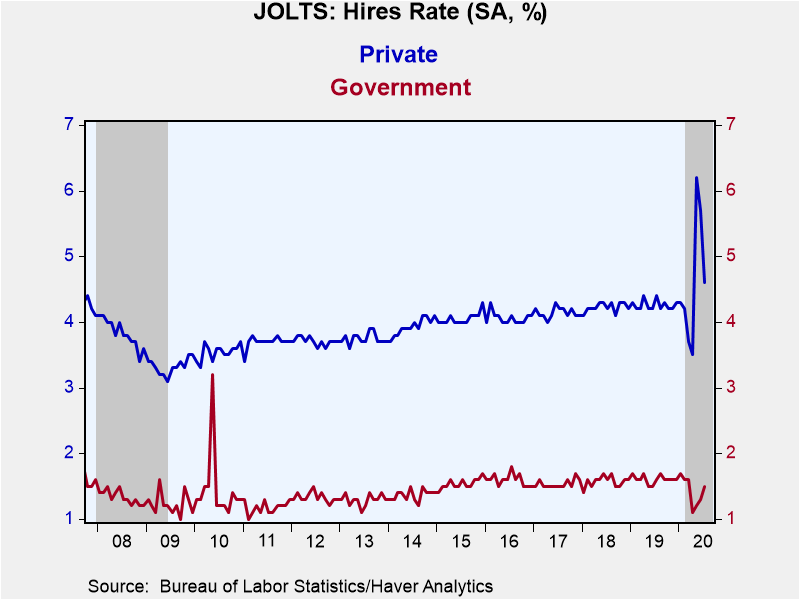
In July, the level of hiring fell 17.0% to 5.787 million (-3.1% y/y) following a 3.2% June decline. The hiring rate fell sharply to 4.1%, down from the record 5.4% in May. Private sector hiring fell 2.7% y/y and government hiring was off 10.0% y/y. Hiring in the factory sector fell 4.2% y/y but leisure & hospitality hiring rose 4.3% y/y. Professional & business service sector hiring weakened 4.9% y/y and education and health services hiring declined 2.0% y/y.
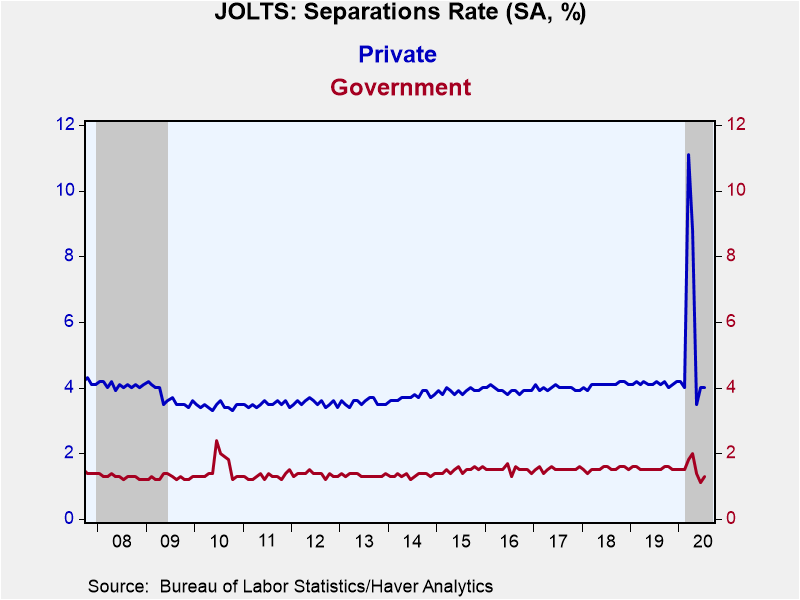
Data on job separations reflect a combination of layoffs and quits. The steady total separations rate of 3.6% compared to the record 9.7% in March. The level of separations declined 13.2% y/y. Private sector separations fell 13.0% y/y and the separations rate remained at 4.0%, up from the near-record low of 3.5% in May. The separations rate was 6.4% in leisure & hospitality, lower than 32.7% in March. Professional & business realized a 5.1% rate after surging to a record 8.0% in March. At 2.5%, the separations rate in education & health services was little-changed near the record low of 2.4%.
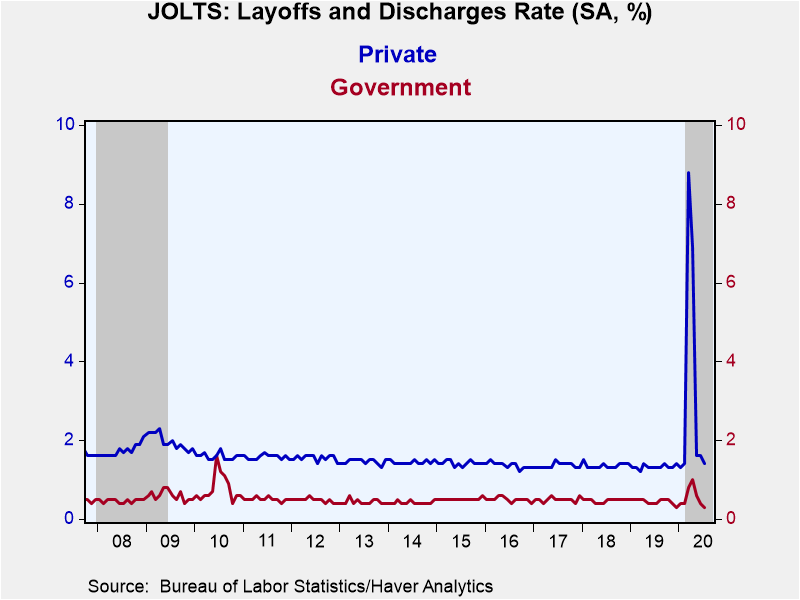
The layoff & discharge rate in the private sector eased to a near-record low of 1.2%. It was a record low of 0.3% in government. The fairly steady 2.8% rate in construction compared to a lessened 1.3% in manufacturing. The 0.8% rate in the information sector was down from a record 3.7% in April. It compared to 0.8% in finance. The professional & business services layoff & discharge rate of 2.1% compared to a record 5.1% in March.
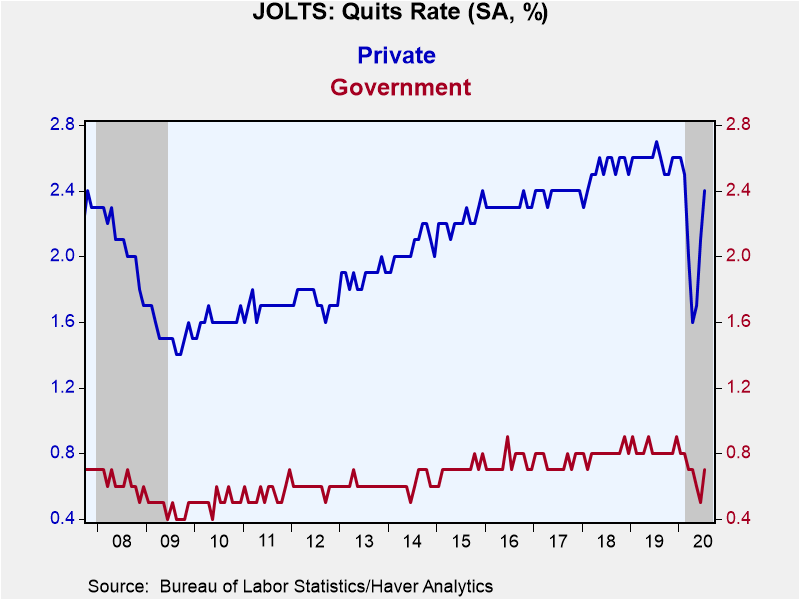
The higher quits rate of 2.4% in the private sector remained up from 1.6% April. It compared to an increased 0.7% in government. In manufacturing, the job quits rate eased m/m to 1.4%, but remained up from a 0.9% low in April. In finance, it rose to 1.1% from a 0.8% cycle-low in April. The quits rate in professional & business services surged to 2.7%, but eased to a still-high 4.0% y/y in leisure & hospitality. The level of job quits in the private sector fell 18.5% y/y and 15.6% y/y in government.
The Job Openings and Labor Turnover Survey (JOLTS) dates to December 2000; the figures are available in Haver's USECON database.
| JOLTS (Job Openings & Labor Turnover Survey, SA) | Jul | Jun | May | Jul'19 | Jul'18 | Jul'17 |
|---|---|---|---|---|---|---|
| Job Openings, Total | ||||||
| Rate (%) | 4.5 | 4.2 | 3.9 | 4.6 | 4.7 | 4.2 |
| Total (000s) | 6,618 | 6,001 | 5,371 | 7,236 | 7,326 | 6,354 |
| Hires, Total | ||||||
| Rate (%) | 4.1 | 5.1 | 5.4 | 4.0 | 3.8 | 3.7 |
| Total (000s) | 5,787 | 6,970 | 7,199 | 5,975 | 5,691 | 5,502 |
| Layoffs & Discharges, Total | ||||||
| Rate (%) | 1.2 | 1.4 | 1.4 | 1.2 | 1.2 | 1.3 |
| Total (000s) | 1,721 | 1,995 | 1,903 | 1,763 | 1,807 | 1,958 |
| Quits, Total | ||||||
| Rate (%) | 2.1 | 1.9 | 1.6 | 2.4 | 2.3 | 2.1 |
| Total (000s) | 2,949 | 2,605 | 2,067 | 3,612 | 3,443 | 3,118 |
Tom Moeller
AuthorMore in Author Profile »Prior to joining Haver Analytics in 2000, Mr. Moeller worked as the Economist at Chancellor Capital Management from 1985 to 1999. There, he developed comprehensive economic forecasts and interpreted economic data for equity and fixed income portfolio managers. Also at Chancellor, Mr. Moeller worked as an equity analyst and was responsible for researching and rating companies in the economically sensitive automobile and housing industries for investment in Chancellor’s equity portfolio. Prior to joining Chancellor, Mr. Moeller was an Economist at Citibank from 1979 to 1984. He also analyzed pricing behavior in the metals industry for the Council on Wage and Price Stability in Washington, D.C. In 1999, Mr. Moeller received the award for most accurate forecast from the Forecasters' Club of New York. From 1990 to 1992 he was President of the New York Association for Business Economists. Mr. Moeller earned an M.B.A. in Finance from Fordham University, where he graduated in 1987. He holds a Bachelor of Arts in Economics from George Washington University.


