 Global| Apr 03 2009
U.S. Jobless Rate Reaches 8.5%;5.1 Million Payroll Jobs Are Lost Since Cycle Peak
by:Tom Moeller
|in:Economy in Brief
Summary
The March employment figures showed that there was little, if any, diminution in the pace of job loss. Nonfarm payrolls fell an expected 663,000 following their unrevised 651,000 worker drop during February. The loss of employment [...]
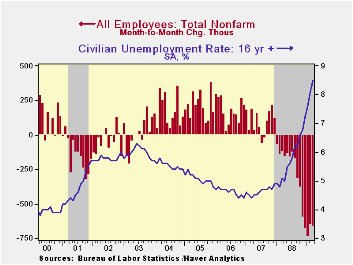 The March
employment figures showed that there was little, if any, diminution in
the pace of job loss. Nonfarm payrolls fell an
expected 663,000 following their unrevised 651,000 worker drop during
February. The loss of employment spread across industries. The Bureau
of Labor Statistics indicated, furthermore, that the number of payroll
jobs lost during this recession so far totals 5.1 million, the record
for a 15-month period. Even after accounting for the labor force's
larger size, that's a huge number. In percentage terms, jobs are down
3.7% since the 2007 peak, close to a record.
The March
employment figures showed that there was little, if any, diminution in
the pace of job loss. Nonfarm payrolls fell an
expected 663,000 following their unrevised 651,000 worker drop during
February. The loss of employment spread across industries. The Bureau
of Labor Statistics indicated, furthermore, that the number of payroll
jobs lost during this recession so far totals 5.1 million, the record
for a 15-month period. Even after accounting for the labor force's
larger size, that's a huge number. In percentage terms, jobs are down
3.7% since the 2007 peak, close to a record.
The weakness in payrolls also was associated with a jump in the unemployment rate to an expected 8.5%, the highest level since November of 1983. The unemployment rate reached its recent low of 4.4% in October of 2006. Last months' increase was fueled by an 861,000 drop in household employment (-3.5% y/y) and a 166,000 drop (+0.1% y/y) drop in the labor force.
Long-term unemployment has risen substantially.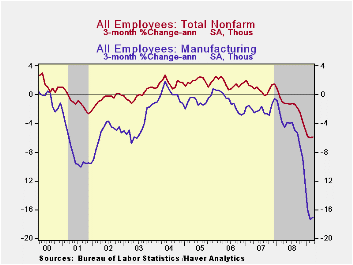 The
average duration of unemployment rose even further in March to 20.1
weeks, up from 16.9 weeks during 2007. The number of those unemployed
for longer than 15 weeks more than doubled during the last year and
they accounted for nearly half of all those who are unemployed.
Long-term unemployment has discouraged workers. The ranks of those who
have dropped out of the labor force has grown by nearly one-quarter
during the last year to 5.8 million.
The
average duration of unemployment rose even further in March to 20.1
weeks, up from 16.9 weeks during 2007. The number of those unemployed
for longer than 15 weeks more than doubled during the last year and
they accounted for nearly half of all those who are unemployed.
Long-term unemployment has discouraged workers. The ranks of those who
have dropped out of the labor force has grown by nearly one-quarter
during the last year to 5.8 million.
The payroll employment figures indicate that the breadth of job loss continues to grow. Only 22.0% of industries were hiring last month, half that of last March and down from the 2006 peak of 24.9%. Over a six-month period, just 15.7% of firms were hiring. The breadth of the downturn includes 126,000 construction industry jobs lost last month, bringing the total to 1.3 million since early 2007. Factory jobs were down another 161,000 in March, adding to the 10-year downtrend during which over 5 million jobs (29.1%) have been shed. The job market has turned so sour that the somewhat immune service sector has suffered. It lost 353,000 jobs last month and 2.8 million (3.0%) since the peak in late 2007. Even government sector hiring has slowed. The 81,000 rise in payrolls last month left them up just 0.4% y/y. Hiring by local governments has been unchanged since last year.
Fewer workers worked fewer hours last
month and the length of the average workweek fell to 33.2 hours, a
record low. 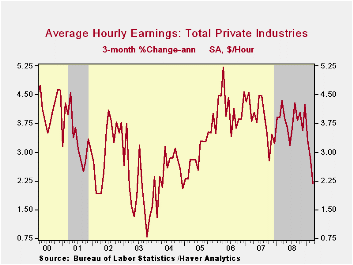 For the first quarter, the combination of lower employment
and fewer hours-worked brought aggregate hours down by 8.7% (AR) from
4Q' 08. That rate of decline was even faster than during 4Q and
suggests negative growth in real GDP in excess of 7% in 1Q '09.· The
weak labor market has taken a toll on average hourly earnings in
private industries. The 0.2% gains in each of the last three months
lowered the annualized rate of growth by half since last year to 2.2%.
In the construction and the goods producing sectors, growth in average
hourly earnings was negative.
For the first quarter, the combination of lower employment
and fewer hours-worked brought aggregate hours down by 8.7% (AR) from
4Q' 08. That rate of decline was even faster than during 4Q and
suggests negative growth in real GDP in excess of 7% in 1Q '09.· The
weak labor market has taken a toll on average hourly earnings in
private industries. The 0.2% gains in each of the last three months
lowered the annualized rate of growth by half since last year to 2.2%.
In the construction and the goods producing sectors, growth in average
hourly earnings was negative.
The figures referenced above are available in Haver's USECON database. Additional detail can be found in the LABOR and in the EMPL databases.
Policies to Bring Us Out of the Financial Crisis and Recession is this morning's speech by Fed Vice Chairman Donald L. Kohn and it is available here.
| Employment: 000s | March | February | January | Y/Y | 2008 | 2007 | 2006 |
|---|---|---|---|---|---|---|---|
| Payroll Employment | -663 | -651 | -741 | -3.5% | -0.4% | 1.1% | 1.8% |
| Previous | -- | -651 | -655 | -- | -0.3% | 1.1% | 1.8% |
| Manufacturing | -161 | -169 | -262 | -9.8% | -3.3% | -2.0% | -0.5% |
| Construction | -126 | -107 | -135 | -12.5% | -5.5% | -0.8% | 4.9% |
| Service Producing | -358 | -366 | -336 | -2.2% | 0.2% | 1.6% | 1.8% |
| Average Weekly Hours | 33.2 | 33.3 | 33.3 | 33.8 (March '08) | 33.6 | 33.8 | 33.9 |
| Average Hourly Earnings | 0.2% | 0.2% | 0.2% | 3.4% | 3.8% | 4.0% | 3.9% |
| Unemployment Rate | 8.5% | 8.1% | 7.6% | 4.8% March '08) | 5.8% | 4.6% | 4.6% |
by Tom Moeller April 3, 2009
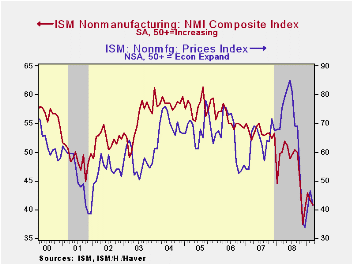
The service sector remains under pressure. The March Composite Index for the nonmanufacturing sector from the Institute for Supply Management (ISM) slipped further to 40.8 from an unrevised February reading of 41.6. Consensus expectations were for a reading of 42.0. For the quarter as a whole, the index edged up to 41.8 from the low of 40.7 during 4Q '08. A level of the ISM index below 50 indicates declining activity. Since the series' inception in 1997 there has been a 48% correlation between the level of the business activity index in the nonmanufacturing sector and the Q/Q change in real GDP for the services and the construction sectors.
Despite the decline in the overall index, the business
activity index improved last month. The employment index, however,
offset that rise with a decline to near the cycle low. Since the
series' inception in 1997 there has been a 56% correlation between the
level of the ISM nonmanufacturing employment index and the m/m change
in payroll employment in the service-producing plus the construction
industries.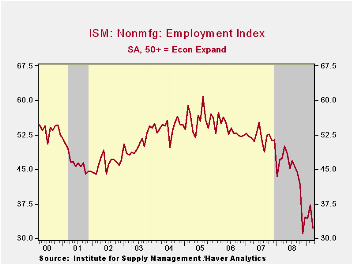
Pricing power fell back again after February improvement. Since its inception ten years ago, there has been a 60% correlation between the price index and the q/q change in the GDP services chain price index.
Beginning with the January 2008 Nonmanufacturing Report On Business®, the composite index is calculated as an indicator of the overall economic condition for the non-manufacturing sector. It is a composite index based on the diffusion indices for four of the indicators (business activity, new orders, employment and supplier deliveries) with equal weights. The latest report from the ISM can be found here.
ISM surveys more than 370 purchasing managers in more than 62 industries including law firms, hospitals, government and retailers. The nonmanufacturing survey dates back to July 1997.
Credit Market Competition and the Nature of Firms from the Federal Reserve Bank of New York is available here.
| ISM Nonmanufacturing Survey | March | February | March '08 | 2008 | 2007 | 2006 |
|---|---|---|---|---|---|---|
| Composite Index | 40.8 | 41.6 | 49.9 | 47.4 | 53.5 | 55.7 |
| Prices Index | 41.5 | 46.5 | 75.5 | 66.0 | 63.8 | 65.3 |
by Robert Brusca April 3, 2009
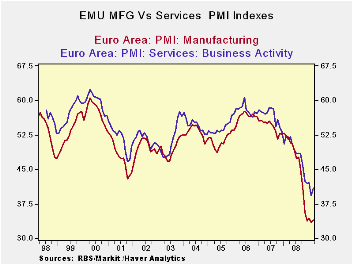
In the Market PMI framework Europe is stabilizing as the rates
of decline in MFG and Services bottom and begin to show some
improvement. But the EU framework of surveys shows declines are still
in train. The table above shows the EMU and EU EC-Commission readings
along with the Market PMI readings. They are in conflict. The EC
readings for services are mostly on their lows while the Market figures
have risen from their respective lows.
Germany, France, Italy Spain and Ireland each showed Service
sector improvement in March in the Market framework. The UK also showed
some nice improvement. All the indices are still below 50, indicating
ongoing contraction for the sector. The three-month averages are still
falling and MEU Ireland France and UK each do show current market
reading that surpass their respective three-month averages a good sign
for stability and recovery.
| NTC Services Indices for EU/EMU | |||||||
|---|---|---|---|---|---|---|---|
| Mar-09 | Feb-09 | Jan-09 | 3Mo | 6Mo | 12Mo | Percentile | |
| Euro-13 | 40.95 | 39.24 | 42.16 | 40.78 | 42.11 | 45.80 | 8.0% |
| Germany | 42.30 | 41.32 | 45.20 | 42.94 | 44.81 | 48.70 | 5.0% |
| France | 43.64 | 40.18 | 42.56 | 42.13 | 43.44 | 46.64 | 14.1% |
| Italy | 39.10 | 37.85 | 41.10 | 39.35 | 40.58 | 44.45 | 5.2% |
| Spain | 34.11 | 31.73 | 31.84 | 32.56 | 31.71 | 35.40 | 18.3% |
| Ireland | 35.69 | 31.78 | 33.94 | 33.80 | 34.03 | 38.10 | 10.8% |
| EU only | |||||||
| UK (CIPs) | 45.47 | 43.24 | 42.48 | 43.73 | 42.31 | 45.31 | 26.4% |
| US NONFMG ISM | #N/A | 41.60 | 42.90 | #N/A | #N/A | #N/A | #N/A |
| EU Commission Indices for EU and EMU | |||||||
| EU Index | Mar-09 | Feb-09 | Jan-09 | 3Mo | 6Mo | 12Mo | Percentile |
| EU Services | -31 | -29 | -28 | -32.67 | -29.50 | -23.25 | 0.0% |
| EMU | Mar-09 | Feb-09 | Jan-09 | 3Mo | 6Mo | 12Mo | Percentile |
| Services | -25 | -24 | -22 | -23.67 | -17.83 | -8.63 | 0.0% |
| Cons Confidence | -34 | -33 | -31 | -32.67 | -29.50 | -13.50 | 0.0% |
| Consumer confidence by country | |||||||
| Germany-Ccon | -31 | -29 | -27 | -29.00 | -22.67 | -14.08 | 0.0% |
| France-Ccon | -36 | -36 | -35 | -35.67 | -33.67 | -27.33 | 0.0% |
| Ital-Ccon | -31 | -28 | -26 | -28.33 | -27.33 | -25.08 | 0.0% |
| Spain-Ccon | -43 | -48 | -44 | -45.00 | -44.83 | -39.83 | 10.4% |
| UK-Ccon | -28 | -32 | -35 | -31.67 | -29.67 | -24.92 | 18.4% |
| percentile is over range since May 2000 | |||||||

Tom Moeller
AuthorMore in Author Profile »Prior to joining Haver Analytics in 2000, Mr. Moeller worked as the Economist at Chancellor Capital Management from 1985 to 1999. There, he developed comprehensive economic forecasts and interpreted economic data for equity and fixed income portfolio managers. Also at Chancellor, Mr. Moeller worked as an equity analyst and was responsible for researching and rating companies in the economically sensitive automobile and housing industries for investment in Chancellor’s equity portfolio. Prior to joining Chancellor, Mr. Moeller was an Economist at Citibank from 1979 to 1984. He also analyzed pricing behavior in the metals industry for the Council on Wage and Price Stability in Washington, D.C. In 1999, Mr. Moeller received the award for most accurate forecast from the Forecasters' Club of New York. From 1990 to 1992 he was President of the New York Association for Business Economists. Mr. Moeller earned an M.B.A. in Finance from Fordham University, where he graduated in 1987. He holds a Bachelor of Arts in Economics from George Washington University.
More Economy in Brief


