 Global| Nov 06 2009
U.S. Jobless Rate Exceeds 10%While Payrolls Decline
by:Tom Moeller
|in:Economy in Brief
Summary
The October employment report from the Bureau of Labor Statistics contained no good news on labor market conditions. That especially was true of the unemployment rate. It rose to 10.2%, the highest since early-1983 just following the [...]
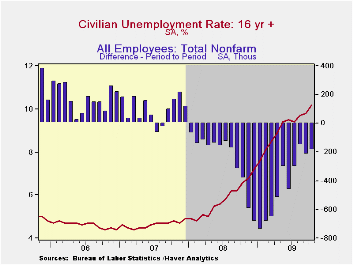
The October employment report from the Bureau of Labor Statistics contained no good news on labor market conditions. That especially was true of the unemployment rate. It rose to 10.2%, the highest since early-1983 just following the severe recession of 1981-82. A 9.9% rate had been expected. Continued declines in employment were evident from the payroll survey where the total number of jobs fell 190,000 which was about as expected. Revisions indicated that September and August payrolls fell less than reported initially. All in all, the best that can be said about the job market is that employment is falling more slowly than earlier this year.
 The increase in the jobless rate to 10.2% was due to a 589,000
(-4.4% y/y) decline in household employment which followed a 785,000
September drop. These declines were shallower than the worst monthly
declines of this past winter, but not by much. The contraction in the
labor force, reflecting more discouraged workers, similarly was reduced
m/m from September and from earlier this year. However, the y/y decline
of 0.6% was the worst since 1952.
The increase in the jobless rate to 10.2% was due to a 589,000
(-4.4% y/y) decline in household employment which followed a 785,000
September drop. These declines were shallower than the worst monthly
declines of this past winter, but not by much. The contraction in the
labor force, reflecting more discouraged workers, similarly was reduced
m/m from September and from earlier this year. However, the y/y decline
of 0.6% was the worst since 1952.
The official unemployment rate continues to pale in comparison
to the rate which includes "marginally attached workers" and those who
are working part-time for economic reasons. It rose to a record 17.5%.
Another tally of joblessness indicates that with "discouraged workers"
the unemployment rate rose last month to 10.7%. Not only are more
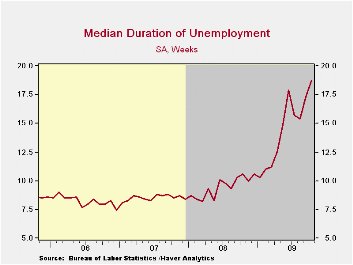
individuals unemployed or have stopped looking for work, but the median
duration of unemployment jumped last month to a record high of 18.7
weeks. The ranks of those unemployed for 27 weeks or more rose to 5.594
million (145.9% y/y), also an historic high. By educational attainment,
those with a high school diploma but no college saw employment fall
6.3% y/y while employment of those with a bachelor's degree or higher
rose 0.1% y/y.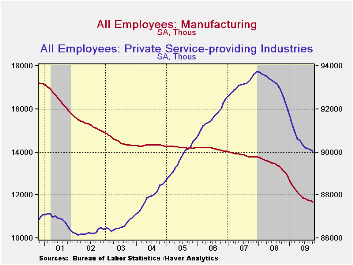
Nonfarm payrolls fell 190,000 which roughly equaled expectations for a 175,000 worker decline. So far during this recession employment has fallen by a total of 7.4 million, by far the record for a 22-month period. In percentage terms, jobs are down 5.3% since the 2007 peak, also a record. If there is good news, it's that the decline in payroll declines moderated to an average 188,000 over the last three months versus the hefty rate of 701,000 this past winter.
Just 14.9% of industries raised employment levels during the last twelve months (a new low), compared with 65.5% during 2006. However, over the last three months, the percentage of firms lifting employment has more-than-doubled to 31.0%.
By industry last month declines in payrolls were broad-based,
but they are easing from earlier this year. In private service
industries they fell 61,000 (-2.9% y/y). Payrolls fell in retail trade
(-3.8% y/y), financial (-4.8% y/y), professional & tech
services (-3.4% y/y), but they rose in education (+0.8% y/y) and in the
health sector (2.3% y/y). Employment in the government sector also has
been weak as budgets shrank with lower tax revenues. Last month the
number of jobs overall were unchanged (-0.4% y/y) as were the number of
local gov't jobs (-0.9% y/y). Factory sector jobs fell 61,000 (-1.6%
y/y) last month, continuing a decline which began in 1998. The decline
totals roughly six million jobs, or one-third of the workforce.
Construction jobs fell 62,000, after declining an average 88,000 each
month this year.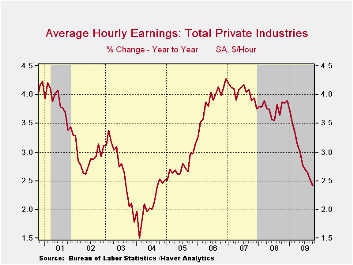
Average hourly earnings increased just 0.3% during October. That slim gain was enough to pull the y/y increase down to 2.4% which was its weakest since late-2004, off from 4.2% reached during 2007. Earnings in the factory sector were unchanged for the second month in the last three (+2.6% y/y). The durable sector's earnings rose 0.3% (3.7%) after a 0.4% September increase. Earnings in the private service sector rose just 0.2% (2.7% y/y) while construction sector earnings recovered 1.5% (2.9% y/y) after a September decline.
The figures referenced above are available in Haver's USECON database. Additional detail can be found in the LABOR and in the EMPL databases.
Housing's Great Fall: Putting Household Balance Sheets Together Again from the Federal Reserve Bank of St. Lois can be found here.
| Employment: 000s | October | September | August | Y/Y | 2008 | 2007 | 2006 |
|---|---|---|---|---|---|---|---|
| Payroll Employment | -190 | -219 | -154 | -4.0% | -0.4% | 1.1% | 1.8% |
| Previous | -- | -263 | -201 | -- | -- | -- | -- |
| Manufacturing | -61 | -45 | -55 | -11.6% | -3.3% | -2.0% | -0.5% |
| Construction | -62 | -68 | -66 | -15.6% | -5.5% | -0.8% | 4.9% |
| Service Producing | -61 | -105 | -24 | -2.4% | 0.2% | 1.6% | 1.8% |
| Average Weekly Hours | 33.0 | 33.0 | 33.1 | 33.5 (Oct. '08) | 33.6 | 33.8 | 33.9 |
| Average Hourly Earnings | 0.3% | 0.1% | 0.4% | 2.4% | 3.8% | 4.0% | 3.9% |
| Unemployment Rate | 10.2% | 9.8% | 9.7% | 6.2% (Sept. '08) | 5.8% | 4.6% | 4.6% |
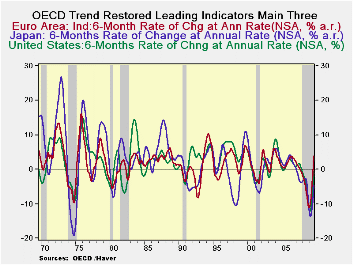
Everybody Is Turning Higher Say OECD LEIs
by Robert Brusca November 6, 2009
In the OECD area everything is coming up roses. Some are more
in bloom than others and some have more thorns than others but the OECD
gave a very upbeat assessment to activity in the OECD areas.
OECD leading indicators ... “point strongly to growth in
Italy, France, the United Kingdom and China, while tentative signals of
expansion have emerged in Canada and Germany," the OECD said. "A
recovery is clearly visible in the United States, Japan and all other
OECD economies and major non-OECD economies," it added.
The OECD indicators selected in the table above all show
strong (double digit) increases over the recent six months expressed as
annual rates of growth. Simple three-, six- and twelve-month growth
rates are positive across all these countries/groups with the exception
of 12 month growth in Japan (see top panel of the table above). The
OECD data are up-to-date though September.
Echoing this sentiment are the new industrial orders for
September released today by Germany that find orders on the growth path
for the seventh month in row. The problem for Germany is that now
domestic orders have dropped for the second month in a row. The two
month drop which amounts to a bit more than a 3% set back comes on the
heels of a 9.5% monthly rate super spike in domestic orders for July.
Still foreign orders continue to expand and Germany’s domestic orders
are not along for the ride.
The OECD data show us why German export orders are rising:
that export oriented economy exports goods globally and the whole OECD
area is having a nice snap back. But Germany is still an important
country in EMU, the largest economy there. Having the German domestic
factory sector so weak on top of previously-reported weakness in German
retail sales, is a clear warning sign to not get too carried away by
optimism.
The OECD area is snapping back from a very ugly recession. But
the recession was so ugly that the snap back can look strong but still
fail to bring growth to a strong enough point to spur a drop in
unemployment. That’s exactly what we seeing in the US. Despite a US MFG
sector that has been posting good results, increases in industrial
production and a rise to strong level for the MFG ISM, the US is not
seeing job growth. Europe is finding some growth deficiencies as well.
Today the UK got an unexpected visit from a higher PPI. The OECD area
is not strong enough to be abele to cope with any inflation signals
just yet. Let’s hope the UK PPI is just a rogue signal. Meanwhile, we
need enough economy strengthening to create job, income and spending
growth while allowing savings to make some headway as well. It’s a tall
order that we are falling short on despite the growth path endorsed by
the OECD.
| OECD Trend-restored leading Indicators | ||||
|---|---|---|---|---|
| Growth progression-SAAR | ||||
| 3Mos | 6Mos | 12mos | Yr-Ago | |
| OECD | 15.8% | 14.9% | 1.5% | -6.5% |
| OECD7 | 16.8% | 15.3% | 0.5% | -6.9% |
| OECD.Ezone | 16.9% | 16.6% | 4.0% | -7.9% |
| OECD.Japan | 13.1% | 10.9% | -4.7% | -4.5% |
| OECD US | 16.8% | 15.0% | -0.6% | -6.7% |
| Six month readings at 6-Mo Intervals: | ||||
| Recent six | 6Mo Ago | 12Mo Ago | 18MO Ago | |
| OECD | 14.9% | -10.3% | -10.5% | -2.3% |
| OECD7 | 15.3% | -12.3% | -10.7% | -3.0% |
| OECD.Eur | 16.6% | -7.3% | -12.3% | -3.3% |
| OECD.Japan | 10.9% | -18.1% | -9.2% | 0.4% |
| OECD US | 15.0% | -14.2% | -9.8% | -3.5% |
| Slowdowns indicated by BOLD RED | ||||

Tom Moeller
AuthorMore in Author Profile »Prior to joining Haver Analytics in 2000, Mr. Moeller worked as the Economist at Chancellor Capital Management from 1985 to 1999. There, he developed comprehensive economic forecasts and interpreted economic data for equity and fixed income portfolio managers. Also at Chancellor, Mr. Moeller worked as an equity analyst and was responsible for researching and rating companies in the economically sensitive automobile and housing industries for investment in Chancellor’s equity portfolio. Prior to joining Chancellor, Mr. Moeller was an Economist at Citibank from 1979 to 1984. He also analyzed pricing behavior in the metals industry for the Council on Wage and Price Stability in Washington, D.C. In 1999, Mr. Moeller received the award for most accurate forecast from the Forecasters' Club of New York. From 1990 to 1992 he was President of the New York Association for Business Economists. Mr. Moeller earned an M.B.A. in Finance from Fordham University, where he graduated in 1987. He holds a Bachelor of Arts in Economics from George Washington University.
More Economy in Brief


