Global| Oct 05 2009
U.S. ISM Nonmanufacturing IndexIncreases To Highest Since May '08
by:Tom Moeller
|in:Economy in Brief
Summary
Improvement in service sector activity broadened last month to its highest level since May of last year. The Composite Index for the nonmanufacturing sector from the Institute for Supply Management (ISM) rose to 50.9, a level that [...]
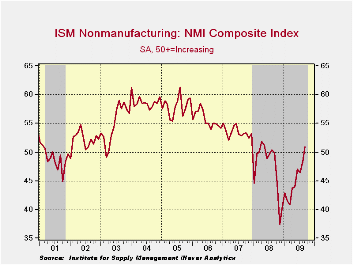 Improvement
in service sector activity broadened last month to its highest level
since May of last year. The Composite Index for the nonmanufacturing
sector from the Institute for Supply Management (ISM) rose to 50.9, a
level that indicates there was growth in overall service sector
activity. The latest level was the highest since May of last year and
the figure outpaced Consensus expectations for an increase to 50.0. A
level of the ISM index above 50 indicates rising overall service sector
activity. Since the series' inception in 1997 there has been a 64%
correlation between the level of the composite index index in the
nonmanufacturing sector and the Q/Q change in real GDP for the services
and the construction sectors.
Improvement
in service sector activity broadened last month to its highest level
since May of last year. The Composite Index for the nonmanufacturing
sector from the Institute for Supply Management (ISM) rose to 50.9, a
level that indicates there was growth in overall service sector
activity. The latest level was the highest since May of last year and
the figure outpaced Consensus expectations for an increase to 50.0. A
level of the ISM index above 50 indicates rising overall service sector
activity. Since the series' inception in 1997 there has been a 64%
correlation between the level of the composite index index in the
nonmanufacturing sector and the Q/Q change in real GDP for the services
and the construction sectors.
ISM surveys more than 370 purchasing managers in more than 62 industries including law firms, hospitals, government and retailers. The nonmanufacturing survey dates back to July 1997. The figures are available in Haver's USECON database.
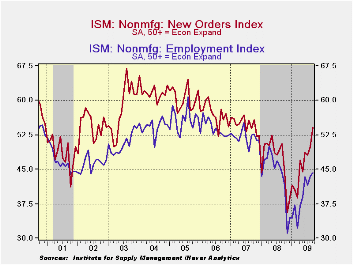 The
improvement in the index again was broad-based amongst the
component series. The business activity index for the service sector
remained above the break-even level of 50 for the second month. The new
orders series also broached 50, up from November's low of 35.6. In
addition, the employment index rose to 44.2 and that was the highest
level since August of last year. Since the series' inception in 1997
there has been an 80% correlation between the level of the ISM
nonmanufacturing employment index and the m/m change in payroll
employment in the service-producing plus the construction
industries.
The
improvement in the index again was broad-based amongst the
component series. The business activity index for the service sector
remained above the break-even level of 50 for the second month. The new
orders series also broached 50, up from November's low of 35.6. In
addition, the employment index rose to 44.2 and that was the highest
level since August of last year. Since the series' inception in 1997
there has been an 80% correlation between the level of the ISM
nonmanufacturing employment index and the m/m change in payroll
employment in the service-producing plus the construction
industries.
>Beginning with the January 2008 Nonmanufacturing Report On Business®, the composite index is calculated as an indicator of the overall economic condition for the non-manufacturing sector. It is a composite index based on the diffusion indices of four of the indicators (business activity, new orders, employment and supplier deliveries) with equal weights. The latest report from the ISM can be found here.
Housing's Great Fall: Putting Household Balance Sheets Together Again from the Federal Reserve Bank of St. Louis can be found here.
| ISM Nonmanufacturing Survey | September | August | September '08 | 2008 | 2007 | 2006 |
|---|---|---|---|---|---|---|
| Composite Index | 50.9 | 48.4 | 50.0 | 47.4 | 53.5 | 55.7 |
| Business Activity | 55.1 | 51.3 | 51.5 | 47.4 | 56.0 | 58.0 |
| New Orders | 54.2 | 49.9 | 50.6 | 47.0 | 54.8 | 57.1 |
| Employment | 44.3 | 43.5 | 44.2 | 43.8 | 52.0 | 53.8 |
| Supplier Deliveries | 50.0 | 49.0 | 53.5 | 51.1 | 51.1 | 53.8 |
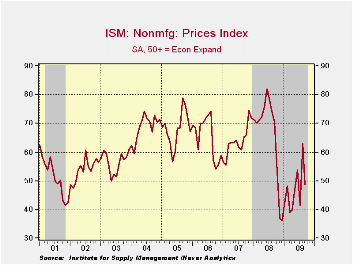
| Prices Index | 48.8 | 63.1 | 70.6 | 66.0 | 63.8 | 65.3 |
Retail Sales in The Euro Area Get a Lift From Price Increases
by Louise Curley October 5, 2009
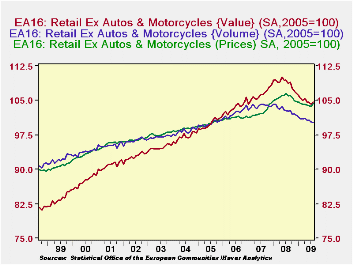 There is a little good news
in today's preliminary estimates
of August retail trade for the Euro Area. The value of trade managed a
small increase of 0.40% after three successive monthly declines. The
volume of trade actually declined by 0.18%. It was only a rise in
prices of 0.58% that accounted for the rise in the value of trade. The
first chart shows indexes of the value, volume and prices of Euro
Retail Trade. (We calculated the index of prices by dividing the index
of value of trade by the index of volume and multiplying the result by
100.).These are preliminary estimates for the whole area because not
all 16 countries have yet reported retail sales data.
There is a little good news
in today's preliminary estimates
of August retail trade for the Euro Area. The value of trade managed a
small increase of 0.40% after three successive monthly declines. The
volume of trade actually declined by 0.18%. It was only a rise in
prices of 0.58% that accounted for the rise in the value of trade. The
first chart shows indexes of the value, volume and prices of Euro
Retail Trade. (We calculated the index of prices by dividing the index
of value of trade by the index of volume and multiplying the result by
100.).These are preliminary estimates for the whole area because not
all 16 countries have yet reported retail sales data.
 France and
Italy
are important omissions.Eurostat estimates total sales after a
significant number of countries have reported sales data. Data are
revised as more countries report.Among those countries that have
reported, Austria, Belgium, Portugal, Slovenia, and Germany show
declines in value; Finland showed no change and Slovakia and Spain
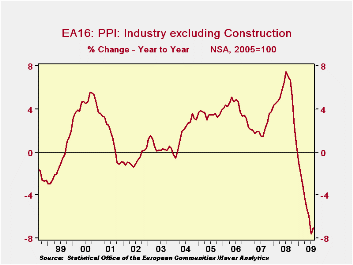
showed small gains..The Producer Price Index was also released today
and it, too, shows a small increase in August. While one month rise
does not set a trend, it may be an indication that the deflationary
impact of falling oil prices has run its course.
France and
Italy
are important omissions.Eurostat estimates total sales after a
significant number of countries have reported sales data. Data are
revised as more countries report.Among those countries that have
reported, Austria, Belgium, Portugal, Slovenia, and Germany show
declines in value; Finland showed no change and Slovakia and Spain
showed small gains..The Producer Price Index was also released today
and it, too, shows a small increase in August. While one month rise
does not set a trend, it may be an indication that the deflationary
impact of falling oil prices has run its course.
| EURO AREA (2005=100) | Aug 09 | Jul 09 | Aug 08 | M/M % | Y/Y % | 2008 | 2007 | 2006 |
|---|---|---|---|---|---|---|---|---|
| Value of Retail Trade | 104.57 | 104.17 | 108.76 | 0.40 | -3.83 | 108.7 | 106.2 | 103.5 |
| Volume of Retail Trade | 100.22 | 100.40 | 102.64 | -0.18 | -236 | 103.0 | 103.7 | 102.2 |
| Retail Trade Price Index | 104.36 | 103.76 | 105.96 | 0.58 | -1.51 | 105.6 | 102.4 | 101.2 |
| Producers Price Index | 106.2 | 105.95 | 114.25 | 0.24 | -7.05 | 111.8 | 106.6 | 104.2 |

Tom Moeller
AuthorMore in Author Profile »Prior to joining Haver Analytics in 2000, Mr. Moeller worked as the Economist at Chancellor Capital Management from 1985 to 1999. There, he developed comprehensive economic forecasts and interpreted economic data for equity and fixed income portfolio managers. Also at Chancellor, Mr. Moeller worked as an equity analyst and was responsible for researching and rating companies in the economically sensitive automobile and housing industries for investment in Chancellor’s equity portfolio. Prior to joining Chancellor, Mr. Moeller was an Economist at Citibank from 1979 to 1984. He also analyzed pricing behavior in the metals industry for the Council on Wage and Price Stability in Washington, D.C. In 1999, Mr. Moeller received the award for most accurate forecast from the Forecasters' Club of New York. From 1990 to 1992 he was President of the New York Association for Business Economists. Mr. Moeller earned an M.B.A. in Finance from Fordham University, where he graduated in 1987. He holds a Bachelor of Arts in Economics from George Washington University.
More Economy in Brief