 Global| Apr 05 2010
U.S. ISM Nonmanufacturing Index Continues To Strengthen
by:Tom Moeller
|in:Economy in Brief
Summary
The service sector clearly is on the road to recovery. The Institute for Supply Management's (ISM) Composite Index for the service & construction sectors rose in March to 55.4 from 53.0 in February. It was the third consecutive [...]
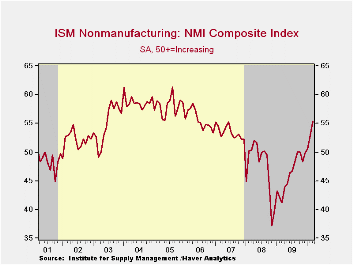
The service sector clearly is on the road to recovery. The Institute for Supply Management's (ISM) Composite Index for the service & construction sectors rose in March to 55.4 from 53.0 in February. It was the third consecutive monthly indication of solid expansion and was the index's highest level since early-2006. Moreover, the series has risen considerably from a low of 37.2 late in 2008. The latest figure exceeded Consensus expectations for a reading of 54.0. Since the series' inception in 1997 there has been a 65% correlation between the level of the composite index in the nonmanufacturing sector and the q/q change in real GDP for the services and the construction sectors.
ISM surveys more than 370 purchasing managers in more than 62 industries including law firms, hospitals, government and retailers. The nonmanufacturing survey dates back to July 1997. The figures are available in Haver's USECON database.
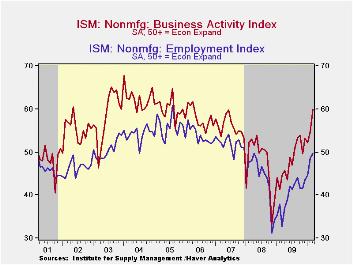
The business activity index for the nonmanufacturing sector surged m/m to 60.0 which was the highest level since early-2006. The new orders index also rose considerably to 62.3, the highest level since 2005. Thirty-seven percent of respondents reported higher orders while only 14% reported them lower. Finally, the employment index rose to nearly break-even. The latest level of 49.8 was the highest level since April 2008 and was up sharply from the late-2008 low. Since the series' inception in 1997 there has been an 80% correlation between the level of the ISM nonmanufacturing employment index and the m/m change in payroll employment in the service-producing plus the construction industries.
Pricing power also improved to the strongest since September 2008 and was up sharply from the 2008 low. Thirty-two percent of respondents reported higher prices while just 5% reported them lower. At the worst, late in 2008, 41% reported lower prices. Since its inception ten years ago, there has been a 73% correlation between the price index and the q/q change in the GDP services chain price index.
Beginning with the January 2008 Nonmanufacturing Report On Business®, the composite index is calculated as an indicator of the overall economic condition for the non-manufacturing sector. It is a composite index based on the diffusion indices of four of the indicators (business activity, new orders, employment and supplier deliveries) with equal weights. The latest report from the ISM can be found here.
| ISM Nonmanufacturing Survey | March | February | January | March '09 | 2009 | 2008 | 2007 |
|---|---|---|---|---|---|---|---|
| Composite Index | 55.4 | 53.0 | 50.5 | 41.2 | 46.2 | 47.3 | 53.5 |
| Business Activity | 60.0 | 54.8 | 52.2 | 44.5 | 48.0 | 47.4 | 56.0 |
| New Orders | 62.3 | 55.0 | 54.7 | 39.4 | 47.9 | 47.0 | 54.8 |
| Employment | 49.8 | 48.6 | 44.6 | 32.8 | 39.9 | 43.8 | 52.0 |
| Supplier Deliveries (NSA) | 49.5 | 53.5 | 50.5 | 48.0 | 49.0 | 51.1 | 51.1 |
| Prices Index | 62.9 | 60.4 | 61.2 | 40.8 | 49.4 | 66.0 | 63.8 |
by Tom Moeller April 5, 2010
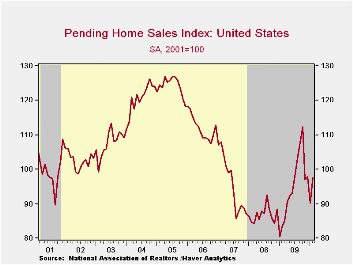
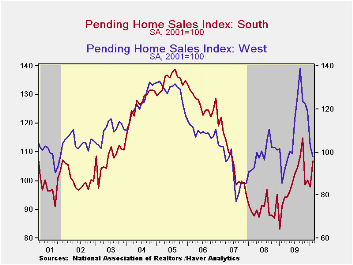
It appears that snow-storms in February didn't dampen home sales as much as during the prior month. The National Association of Realtors (NAR) reported that pending sales of existing single-family homes recovered virtually all of the January decline with an 8.2% increase. The recovery left home sales up nearly one-quarter from the low in January of last year. The latest gain compares with Consensus expectations for a slight m/m decline.
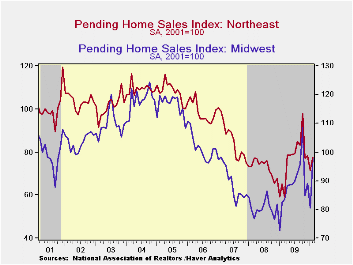
The m/m performance of home sales varied across the country. A large increase in the Midwest was accompanied by smaller increases in the Northeast and in the South while sales fell in the West.
These home sales figures are analogous to the new home sales data from the Commerce Department in that they measure existing home sales when the sales contract is signed, not at the time the sale is closed. The series dates back to 2001 and the data is available in Haver's PREALTOR database.
How Much Is That Home Really Worth? Appraisal Bias and House-Price Uncertainty from the Federal Reserve Bank of Philadelphia can be found here.
| Pending Home Sales (2001=100) | February | January | December | Y/Y | 2009 | 2008 | 2007 |
|---|---|---|---|---|---|---|---|
| Total | 97.6 | 90.2 | 97.8 | 17.3% | 95.1 | 86.9 | 95.9 |
| Northeast | 77.7 | 71.3 | 78.1 | 18.8 | 76.7 | 73.0 | 86.1 |
| Midwest | 97.9 | 80.4 | 89.2 | 18.7 | 88.8 | 80.7 | 89.6 |
| South | 107.0 | 98.0 | 100.2 | 17.5 | 98.9 | 90.3 | 107.4 |
| West | 98.0 | 102.9 | 118.5 | 14.6 | 109.9 | 99.2 | 92.1 |
by Robert Brusca April 5, 2010
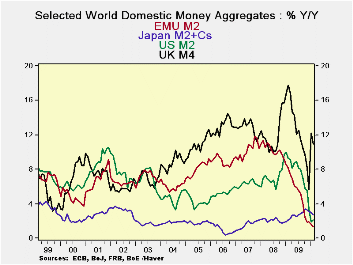
So far only the UK is showing a sharp shift in its rate of money growth. But the e-Zone is showing a small money growth revival. US money growth has been dropping very rapidly but is showing a hint of stability- still its sequential rates of growth continue to ramp down. Japan’s money growth that has so very steady has taken a step lower. But Japan’s Tankan report suggests that the economy there is getting better and that the downturn in money growth may not be signaling a new round of weakness. In truth central banks have not taken their cues from money growth for some time. Is that about to change?
EMU, the US and the UK have seen the biggest winding down in money growth rates from their cycle peaks. The UK has seen that wind-down give way to a bounce. The US shows a hint of some stabilization in money growth but real balances are contacting over the most recent three-months. EMU shows only a slowing in the pace of money supply deceleration in its Yr/Yr trends but real balances over three-months have posted positive growth. . In the Zone Credit to residents and loans continue to contract in real terms but they are slowing their pace of contraction, too.
Money growth rates seem to be showing signs - or at least hints -of stabilization. In the US the jobs figures for March hint that the period of job contraction may have some to a close. In Japan the tankan report was better than expected. EMU and the UK continue to blow and hot and cold reports back and forth. Europe still seems to be having a tough time posting consistent growth numbers. EMU, in particular is dealing with PR issues and the reality of very divergent circumstances across member countries, challenging the ECB. The UK continues to get battered with some seasonably extreme weather but also to continue to issue a very uneven stream of economic reports.
In the wake of the US jobs report the entire global picture is looking better. Commodity prices tell a story of new confidence in growth prospects. Money supply trends do not wave any cautionary flags about building inflation, however. The UK has persistently high money growth and is also experiencing an inflation overshoot. The Bank of England has said it will let it run its course since it views the overshoot as being not problematical. In the US, with job growth coming on stream, ‘inflationists’ are sounding warning signals. In Europe recent German inflation reports have been boosted by rising oil prices, this will make the ECB wary regardless of other zone issues. Bond yields are moving up.
It is true that there is a shifting of trends and of risks but it is really even more subtle than what it seems. There remains a great deal of slack in the global economy. In the US alone the recession displaced eight and one-half million people (net!). Putting 162,000 back to work in one month can’t ramp up much of an inflation risk can it? I suspect that fears of inflation are overdone and commodity prices which are reacting to something else (call it perceived scarcity) are acting as a misaligned lighting rod for inflation fears.
We do think this cycle is entering a different, better, growth phase globally, but we do not think inflation is much of a threat. We think this confusion will however drive prices and bond yields quite possibly too far ahead whatever risks may emerge.
| Look at Global and Euro Liquidity Trends | |||||||
|---|---|---|---|---|---|---|---|
| Saar-all | Euro Measures (E13): Money & Credit | G-10 Major Markets: Money | Memo | ||||
| €-Supply M2 | Credit:Resid | Loans | $US M2 | £UK M4 | ¥Jpn M2+Cds | OIL:WTI | |
| 3-MO | 3.1% | 0.1% | 0.7% | 0.4% | 33.8% | 1.6% | -10.3% |
| 6-MO | 0.6% | -0.2% | -0.1% | 2.5% | 21.1% | 2.4% | 14.3% |
| 12-MO | 1.4% | -0.2% | -0.8% | 2.1% | 11.0% | 2.7% | 94.7% |
| 2Yr | 4.7% | 3.0% | 1.9% | 5.7% | 14.3% | 2.4% | -10.4% |
| 3Yr | 6.9% | 6.4% | 4.9% | 6.1% | 13.4% | 2.4% | 8.8% |
| Real Balances: deflated by Own CPI. Oil deflated by US CPI | |||||||
| 3-MO | 1.9% | -1.2% | -0.5% | -0.9% | 27.3% | 0.8% | -11.5% |
| 6-MO | -0.8% | -1.6% | -1.5% | 0.6% | 16.4% | 2.4% | 12.2% |
| 12-MO | 0.5% | -1.1% | -1.7% | -0.1% | 7.7% | 3.9% | 90.5% |
| 2Yr | 3.6% | 2.0% | 0.9% | 4.5% | 10.9% | 3.0% | -11.5% |
| 3Yr | 5.0% | 4.6% | 3.1% | 3.9% | 10.3% | 2.4% | 6.5% |
| All figures are through February | |||||||
by Louise Curley April 5,2010
 Revised data
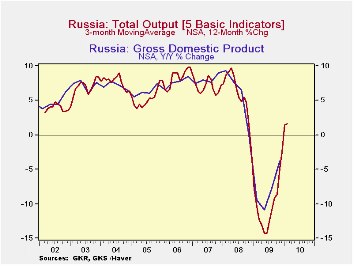
confirm that the Russian economy declined 7.9% in 2009, however, the
revised quarterly data show more deterioration in the first half of the
year and more improvement in the last half of the year than the earlier
data had shown. Moreover, year to year percent changes in the
output of the Five Basic Indicators that Russia publishes have
continued to increase into the first two months of this year.
The Five Basic Indicators are a good predictor of Gross Domestic
Product as can be seen in the first Chart, which shows the three month
Revised data
confirm that the Russian economy declined 7.9% in 2009, however, the
revised quarterly data show more deterioration in the first half of the
year and more improvement in the last half of the year than the earlier
data had shown. Moreover, year to year percent changes in the
output of the Five Basic Indicators that Russia publishes have
continued to increase into the first two months of this year.
The Five Basic Indicators are a good predictor of Gross Domestic
Product as can be seen in the first Chart, which shows the three month
 moving
average of the year to year changes in the Five Basic
indicators compared with the year to year changes in Real GDP.
moving
average of the year to year changes in the Five Basic
indicators compared with the year to year changes in Real GDP.
In addition to using a three month moving average to smooth the total of The Five Basic Indicators, we have used a three month moving average on each of the components: Agriculture, Retail Trade, Construction, Industry and Transportation. Transportation has made the sharpest comeback, with output 7.9% and 9.3% above year ago figures in January and February of this year. February Outputs in Agriculture and Industry were 4.5% and 4.1%, respectfully, above February, 2009. The volume of retail trade was slightly below the year ago figure in February, -0.7%. Construction has improved, but in February was still 8.9% below February, 2009. These data are shown in the table below.
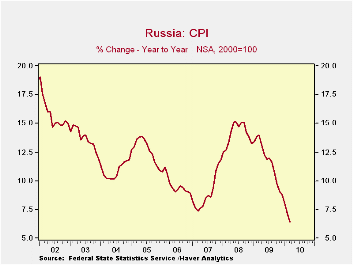
Along with the improvement in physical activity in Russia, there has been a significant decline in inflation as measured by the year to year change in the unseasonally adjusted consumer price index as can be seen in the second chart. The March figure of 6.42% is the lowest value since May of 1998 when the inflation rate was 5.63%
| Five Basic Indicators (3 mo moving average of year to year % change) | Feb 10 | Jan 10 | Dec 09 | Nov 09 | Oct 09 | Sep 09 | Aug 09 | Jul 09 |
|---|---|---|---|---|---|---|---|---|
| Total | 1.6 | 1.4 | -2.5 | -4.9 | -9.2 | -10.9 | -12.6 | -14.3 |
| Agriculture | 4.5 | 4.1 | 5.3 | 5.5 | 0.9 | -1.2 | -4.0 | -0.4 |
| Construction | -8.9 | -10.0 | -11.3 | -15.3 | -16.1 | -17.2 | -17.6 | -19.8 |
| Retail Trade | -0.7 | -3.2 | -6.1 | -8.2 | -9.2 | -9.2 | -8.1 | -6.8 |
| Industry | 4.1 | 4.0 | -2.3 | -6.4 | -11.1 | -11.0 | -11.8 | -13.3 |
| Transportation | 9.3 | 7.9 | 2.2 | -1.8 | -5.8 | -6.9 | -10.3 | -14.2 |
| Q4 09 | Q3 09 | Q2 O9 | Q1 O9 | 2009 | 2008 | 2007 | 2006 | |
| Real GDP (year to year % change) | -3.8 | -4.7 | -10.8 | -9.4 | 7.9 | 5.9 | 8.1 | 7.6 |

Tom Moeller
AuthorMore in Author Profile »Prior to joining Haver Analytics in 2000, Mr. Moeller worked as the Economist at Chancellor Capital Management from 1985 to 1999. There, he developed comprehensive economic forecasts and interpreted economic data for equity and fixed income portfolio managers. Also at Chancellor, Mr. Moeller worked as an equity analyst and was responsible for researching and rating companies in the economically sensitive automobile and housing industries for investment in Chancellor’s equity portfolio. Prior to joining Chancellor, Mr. Moeller was an Economist at Citibank from 1979 to 1984. He also analyzed pricing behavior in the metals industry for the Council on Wage and Price Stability in Washington, D.C. In 1999, Mr. Moeller received the award for most accurate forecast from the Forecasters' Club of New York. From 1990 to 1992 he was President of the New York Association for Business Economists. Mr. Moeller earned an M.B.A. in Finance from Fordham University, where he graduated in 1987. He holds a Bachelor of Arts in Economics from George Washington University.
More Economy in Brief


