 Global| Sep 18 2008
U.S. Initial Unemployment Insurance Claims Near The Highest Since 2002
by:Tom Moeller
|in:Economy in Brief
Summary
Last week, initial claims for unemployment insurance rose to 455,000 from an unrevised level of 445,000 during the prior week. Except for a level at the beginning of last month which was raised by a program to locate and provide extra [...]
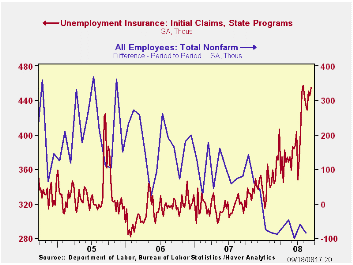
Last week, initial claims for unemployment insurance rose to 455,000 from an unrevised level of 445,000 during the prior week. Except for a level at the beginning of last month which was raised by a program to locate and provide extra benefits to people eligible for jobless benefits, the latest was the highest during this cycle. It also was the highest level since 2002.
The latest figure covers the survey week for September nonfarm payrolls and claims rose 20,000 (4.6%) from the August survey period. During the last ten years there has been a 76% correlation between the level of initial claims and the m/m change in nonfarm payroll employment
The four-week moving average rose to 445,000 (37.7% y/y) and
remained near the highest level since near the end of the 2001
recession. Last month, claims averaged 443,000.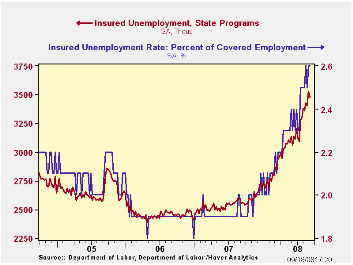
A claims level below 400,000 typically has been associated with positive growth in nonfarm payrolls. During the last ten years there has been a (negative) 76% correlation between the level of initial claims and the m/m change in nonfarm payroll employment. Over the longer period of time, the level of claims for jobless insurance has not trended higher with the size of the labor force due to a higher proportion of self-employed workers who are not eligible for benefits.
Continuing claims for unemployment insurance during the latest week fell 55,000 after a slightly revised 129,000 increase during the prior period. The four-week average rose to 3,461,000, the highest level since July 2003. Continuing claims provide some indication of workers' ability to find employment and they lag the initial claims figures by one week.
The insured rate of unemployment held stable w/w at 2.6%, the highest level since late-2003.
Yesterday's announcement by the Federal Reserve of measures "to improve the liquidity conditions in global financial markets" can be found here.
| Unemployment Insurance (000s) | 09/13/08 | 09/06/08 | Y/Y | 2007 | 2006 | 2005 |
|---|---|---|---|---|---|---|
| Initial Claims | 455 | 445 | 42.6% | 322 | 313 | 331 |
| Continuing Claims | -- | 3,478 | 36.2% | 2,552 | 2,459 | 2,662 |
by Tom Moeller September 18, 2008
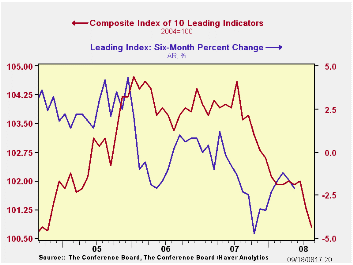
The composite index of leading economic indicators, reported by the Conference Board fell 0.5% last month after an unrevised decline of 0.7% in July. The decline left the six-month percent change at -2.1% which was modestly improved from a -4.7% figure last October.
Last month lower building permits, lower vendor performance and higher claims for unemployment insurance made the largest negative contributions to the index decline. These were partially offset by a steepening of the yield curve (10-year Treasury yield vs. Fed funds rate) and improvement in the University of Michigan index of consumer expectations.
The breadth of one-month increase amongst the leaders' 10
components remained low at 40%. Over a six-month period the breadth of
gain amongst the leaders' components fell back to its cycle low of 20%.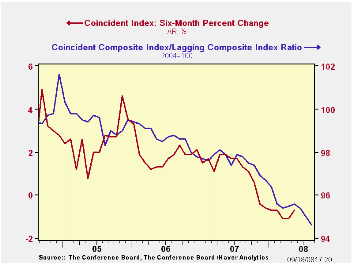
The leading index is based on actual reports for eight economic data series. The Conference Board initially estimates two series, orders for consumer goods and orders for capital goods.
The coincident indicators fell 0.1% after a revised no change during July. Half of the components rose and half fell, but over six months only a quarter are up. Over the last ten years there has been an 86% correlation between the y/y changes in the coincident indicators and real GDP.
The lagging index repeated its increase and rose 0.4%. The ratio of coincident to lagging indicators (a measure of economic excess) declined to its lowest level since 1982.
Visit the Conference Board's site for coverage of leading indicator series from around the world.
Banking Crisis Solutions Old and New from the Federal Reserve Bank of St. Louis can be found here.
| Business Cycle Indicators | August | July | June | May, 6 Month % (AR) | 2007 | 2006 | 2005 |
|---|---|---|---|---|---|---|---|
| Leading | -0.5% | -0.7% | 0.1% | -2.1% | -0.4% | 1.3% | 2.7% |
| Coincident | -0.1 | 0.0 | -0.2 | -0.7 | 1.7% | 2.4% | 2.5% |
| Lagging | 0.4 | 0.4 | 0.0 | 1.4 | 2.9% | 3.1% | 3.1% |
by Tom Moeller September 18, 2008

The Philadelphia Federal Reserve Bank indicated that its September Index of General Business conditions in the manufacturing sector improved sharply. The index reading of 3.8 was up from a revised -12.7 in August and it was the highest level since November of last year. A reading of -10 had been expected for this month.
The Philadelphia Fed constructs a diffusion index for total business activity and each of the sub-indexes. The business conditions index reflects a separate survey question.
During the last ten years there has been a 61% correlation between the level of the Philadelphia Fed Business Conditions Index and the three-month growth in factory sector industrial production. There has been a 43% correlation with q/q growth in real GDP.
The new orders index led this month's improvement with a sharp
rise to 5.8, its first positive reading since December. The shipments
index also improved, but more moderately, to its highest level since
December. 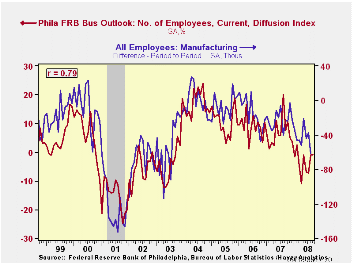
The employment index, at -0.9, held roughly steady with August as 18.2% of respondents expected to increase employment levels while 19.2% expected to decrease them. During the last ten years there has been a 79% correlation between the index level and the m/m change in manufacturing sector payrolls.
The prices paid index fell sharply. The decline to 31.5 brought it to the lowest level in twelve months. During the last ten years there has been a 67% correlation between the prices paid index and the three-month growth in the intermediate goods PPI. There has been an 82% correlation with the change in core intermediate goods prices.
The separate index of expected business conditions in six months improved moderately to the highest level since October of last year. Expectations for new orders and for shipments rose while expectations for employment slipped. The prices fell to its lowest level in over one year.
The latest Business Outlook Survey from the Federal Reserve Bank of Philadelphia can be found here.
| Philadelphia Fed (%) | September | August | September '07 | 2007 | 2006 | 2005 |
|---|---|---|---|---|---|---|
| General Activity Index | 3.8 | -12.7 | 9.2 | 5.1 | 8.1 | 11.5 |
| Prices Paid Index | 31.5 | 57.5 | 23.8 | 26.4 | 36.6 | 40.1 |
by Carol Stone September 18, 2008
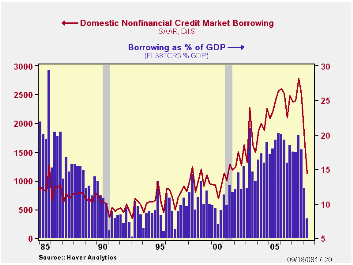
The flows in credit markets in Q2 make us wonder how the US
economy grew at all then. Never in the history of the Federal Reserve's
Flow-of-Funds data has there been such a sudden dramatic plunge in
credit demand. Domestic nonfinancial credit market borrowing amounted
to $1.127 trillion, SAAR, compared with $1.726 trillion in Q1 and
$2.397 trillion in Q2/2007. This quarter was the smallest since Q2/2001
and compares with a peak of $2.780 trillion in Q3/2007. On June 30,
credit market debt outstanding stood 6.7% higher than a year ago, a
slowdown from 8.6% growth from the beginning to the end of 2007.
Relative to the size of the economy, this measure of credit market
borrowing sank to just 7.9% of GDP, down from 12.2% in Q1 and about
18.5% over the previous three years.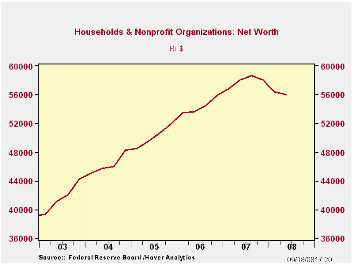
By sector, household borrowing fell to $197 billion, the smallest amount since Q1/1993. Business borrowing, corporate and noncorporate together, decreased to $582 billion, less than half the 2007 total of $1.203 billion; however, business credit usage is more variable generally, and ran to just $449 billion in 2004, when the economy was quite vigorous. State and local governments raised only $11.0 billion in Q2, much weaker than the average of $139 billion over the last five years. Federal government borrowing eased, but at $310 billion during the quarter, it was still near the high end of its recent range.
Returning to the household sector, despite the smaller amount
of people's borrowing in Q2, their net worth still fell. It was $56.0
trillion, down from $56.4 trillion in Q1, $58.1 trillion in Q4/2007 and
the peak of $58.6 trillion in Q3. This is the first decline ever (there
are 56 years of history) in household net worth over a span of three
quarters. It is all the more remarkable because households' total
liabilities actually went down a little, edging to $14.495 from $14.507
trillion. Assets, as seen in the table below, didn't change much, but
with a fall of $500 billion, they went down by more than liabilities
did, eroding the net.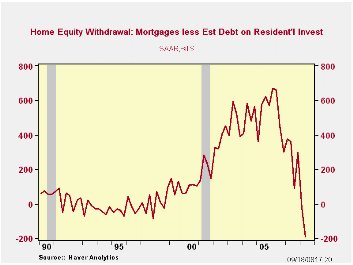
One other note about households: two or three years ago, much was made of "mortgage equity withdrawal", the practice of refinancing one's mortgage and taking out cash to use for other purposes, such as college tuition. This has not only ended, it has now gone the other way. In the Haver-defined series, "MEW" was -$192.1 billion in Q2, meaning that people borrowed less than the amount implied by the volume of residential construction and renovation during the quarter. They were thus contributing to the equity in their property rather than drawing it down, as had been the case over the last 10 years.
The Flow of Funds data are all in Haver's dedicated database FFUNDS. The mortgage equity withdrawal series, those calculated by us and others compiled by researchers at the Fed, are included in the Housing & Construction menus of USECON.
| Flow of Funds (Y/Y % Chg.) | % of Total | 2Q '08 | 1Q '08 | 2007 | 2006 | 2005 |
|---|---|---|---|---|---|---|
| Total Credit Market Debt Outstanding | -- | 6.7 | 7.9 | 8.6 | 9.1 | 9.5 |
| Federal Government | 10% | 7.0 | 5.7 | 4.9 | 3.9 | 7.0 |
| Households | 27% | 4.3 | 5.8 | 6.8 | 10.2 | 11.1 |
| Nonfinancial Corporate Business | 14% | 9.4 | 11.7 | 13.2 | 9.4 | 6.1 |
| Nonfarm, Noncorporate Business | 7% | 11.4 | 13.2 | 13.3 | 12.6 | 13.6 |
| Financial Sectors | 32% | 10.1 | 10.9 | 12.5 | 10.1 | 8.8 |
| Net Worth: Households & Nonprofit Organizations (Trillions) | -- | $55.993 | $56.431 | $58.081 | $55.943 | $51.946 |
| Tangible Assets: Households | -- | $26.149 | $26.331 | $26.574 | $25.930 | $24.369 |
| Financial Assets: Households | -- | $44.340 | $44.606 | $45.905 | $43.486 | $39.777 |
| "Mortgage Equity Withdrawal" (Billions) | -- | -$192.0 | -$27.1 | $282.0 | $520.6 | $531.4 |
by Robert Brusca September 18, 2008
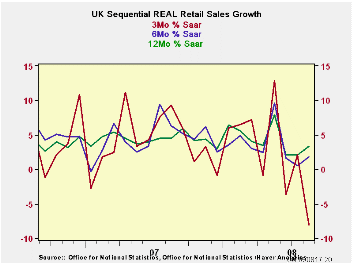
Ironically even with the second strong month of sales increases the three-month growth rate for retail sales in the UK is plunging. Barometers and surveys of retail sales have been weak, so the rise in each of the past two months was a surprise. Even so the three-month growth rate for sales is getting increasingly weaker (see chart). That points out how uneven the slowing in sales has been. In both August and July sales rose by 0.8%. But that compares to a drop in sales of 3.7% in June and that drop is dominating the three-month change. It now appears as if weakness was front loaded and probably exaggerated in June.
Still the trend for sales is lower. In the quarter to date nominal retail sales are rising at a crawl. Real sales, however, are falling at a -0.2% annual rate in Q3 even with the last two-month rise in sales. There is not much doubt that the UK consumer is under pressure or that these rebounds in sales are not a new trend.
UK Real and Nominal Retail Sales| UK Real and Nominal Retail Sales | ||||||||
|---|---|---|---|---|---|---|---|---|
| Nominal | Aug-08 | Jul-08 | Jun-08 | 3-MO | 6-MO | 12-MO | YrAGo | Quarter -2-date |
| Retail Total | 0.8% | 0.8% | -3.7% | -7.9% | 2.6% | 4.1% | 3.5% | 0.5% |
| Food, Beverages & Tobacco | 0.1% | 0.7% | -2.4% | -6.0% | 3.9% | 5.6% | 3.9% | 2.4% |
| Clothing footwear | 3.7% | 3.3% | -8.4% | -7.2% | 5.0% | 6.1% | 3.0% | 11.6% |
| Real | ||||||||
| Retail Ex auto | 1.2% | 0.9% | -4.2% | -8.1% | 1.9% | 3.4% | 4.5% | -0.2% |

Tom Moeller
AuthorMore in Author Profile »Prior to joining Haver Analytics in 2000, Mr. Moeller worked as the Economist at Chancellor Capital Management from 1985 to 1999. There, he developed comprehensive economic forecasts and interpreted economic data for equity and fixed income portfolio managers. Also at Chancellor, Mr. Moeller worked as an equity analyst and was responsible for researching and rating companies in the economically sensitive automobile and housing industries for investment in Chancellor’s equity portfolio. Prior to joining Chancellor, Mr. Moeller was an Economist at Citibank from 1979 to 1984. He also analyzed pricing behavior in the metals industry for the Council on Wage and Price Stability in Washington, D.C. In 1999, Mr. Moeller received the award for most accurate forecast from the Forecasters' Club of New York. From 1990 to 1992 he was President of the New York Association for Business Economists. Mr. Moeller earned an M.B.A. in Finance from Fordham University, where he graduated in 1987. He holds a Bachelor of Arts in Economics from George Washington University.
More Economy in Brief


