 Global| Feb 11 2010
U.S. Initial Jobless Insurance Claims Reverse Three-Week Increase
by:Tom Moeller
|in:Economy in Brief
Summary
Earlier suggestions of labor market deterioration were reversed by today's Labor Department report that initial claims. Jobless insurance fell 43,000 to the lowest level since early-January. Last week's decline to 440,000 followed an [...]
| Today's scheduled reports on retail sales and business inventories will be released tomorrow. |
|---|
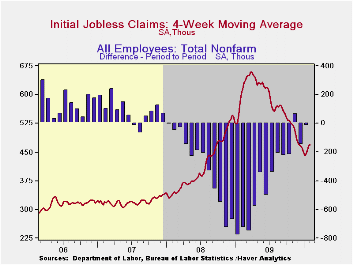 Earlier
suggestions of labor market deterioration were reversed by today's
Labor Department report that initial claims. Jobless insurance fell
43,000 to the lowest level since early-January. Last week's decline to
440,000 followed an upwardly revised increase to 483,000 during the
prior week and claims remained near the lowest level since late-August,
2008. Initial claims were down from the recession peak of 674,000 hit
last March. Consensus expectations had been for a lesser decline to
465,000 claims. The four-week moving average of initial claims fell
slightly to 468,500 and remained near the cycle low.
Earlier
suggestions of labor market deterioration were reversed by today's
Labor Department report that initial claims. Jobless insurance fell
43,000 to the lowest level since early-January. Last week's decline to
440,000 followed an upwardly revised increase to 483,000 during the
prior week and claims remained near the lowest level since late-August,
2008. Initial claims were down from the recession peak of 674,000 hit
last March. Consensus expectations had been for a lesser decline to
465,000 claims. The four-week moving average of initial claims fell
slightly to 468,500 and remained near the cycle low.
Continuing
claims for unemployment insurance during the latest week also declined
 to
a new cycle low and left claims down by one-third since late-June.
Continuing claims are at the lowest level since early-January of last
year. The overall decline is a function of the improved job market but
also reflects the exhaustion of 26 weeks of unemployment benefits.
Continuing claims provide an indication of workers' ability to find
employment. The four-week average of continuing claims fell to a cycle
low of 4,603,500. This series dates back to
1966.
to
a new cycle low and left claims down by one-third since late-June.
Continuing claims are at the lowest level since early-January of last
year. The overall decline is a function of the improved job market but
also reflects the exhaustion of 26 weeks of unemployment benefits.
Continuing claims provide an indication of workers' ability to find
employment. The four-week average of continuing claims fell to a cycle
low of 4,603,500. This series dates back to
1966.
Extended benefits for unemployment insurance rose moderately to 236,041 from its cycle low during the fourth week of January and were down by two-thirds from a peak of 597,688 reached in November.
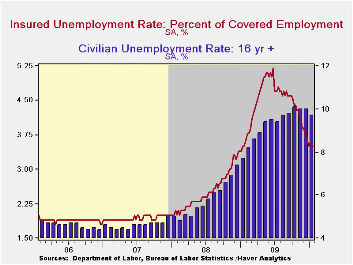
The insured rate of unemployment remained stable
at a low of 3.5%. The rate reached a high of 5.2% during late-June.
During the last ten years, there has been a 93% correlation between the
level of the insured unemployment rate and the overall rate of
 unemployment
published by the Bureau of Labor
Statistics.
unemployment
published by the Bureau of Labor
Statistics.
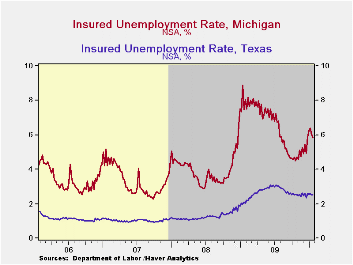
The highest insured unemployment rates in the week ending January 15 were in Alaska (7.5%), Wisconsin (6.4), Pennsylvania (6.2), Montana (6.2), Michigan (5.8), North Carolina (5.4), Washington (5.3) and Connecticut (5.3). The lowest insured unemployment rates were in Virginia (2.3), Texas (2.5), Florida (3.4), Maryland (3.6), Wyoming (3.7), Mississippi (3.8), Ohio (3.9), Indiana (4.0), New York (4.1) and Maine (4.4). These data are not seasonally adjusted but the overall insured unemployment rate is.
The unemployment insurance claims data is available in Haver's WEEKLY database and the state data is in the REGIONW database.
Productivity, Welfare, and Reallocation: Theory and Firm‐Level Evidence from the Federal Reserve Bank of New England can be found here.
| Unemployment Insurance (000s) | 2/5/10 | 1/30/10 | 1/23/10 | Y/Y | 2009 | 2008 | 2007 |
|---|---|---|---|---|---|---|---|
| Initial Claims | 440 | 483 | 472 | -28.7% | 573 | 419 | 321 |
| Continuing Claims | -- | 4,538 | 4,617 | -4.6% | 5,835 | 3,345 | 2,552 |
| Insured Unemployment Rate (%) | -- | 3.5 | 3.5 | 3.8 (2/2009) | 4.4 | 2.5 | 1.9 |
by Robert Brusca February 11, 2010
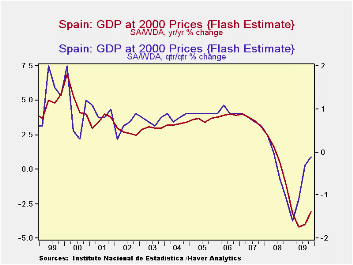 Seven
quarters in a row and still no hint of growth in Spain’s GDP. The
quarter to quarter drops are diminishing and the year-over-year drop is
lessening but the dropping continues.
Seven
quarters in a row and still no hint of growth in Spain’s GDP. The
quarter to quarter drops are diminishing and the year-over-year drop is
lessening but the dropping continues.
On a day that Greece is getting assistance because its own people won’t pay taxes to service the payments on debt for their own bills, it must be a bitter day for Spain. Spain’s construction sector blew up in the financial crisis and has taken the economy down along with it. Spain accounts for the bulk of European unemployment. Because its problem is real estate it will not be fixed soon. Its real estate woes cannot be exported. Spain has a long hard road ahead.
But economists like to look at growth rates and the growth rates in the chart are turning higher. Yes, they are still negative but they are headed higher. Spain has been making progress but not enough to translate into positive growth.
Household consumption has been faltering (we do not have the Q4 reading on this yet). Much of turn has been at the hand of government spending- that’s spending when other sectors won’t. Both exports and imports are rebounding- exports a bit faster.
At this point Spain is still trying just to hold it together. It will still take sometime to know what its recovery is made of. It has yet to cross into that space. Spain remains a euro-laggard.
| Spain's FLASH GDP | ||
|---|---|---|
| Q/Q | Yr/Yr | |
| Q4-2009 | -0.4 | -3.1 |
| Q3-2009 | -1.2 | -4.0 |
| Q2-2009 | -4.4 | -4.2 |
| Q1-2009 | -6.4 | -3.2 |
| Q4-2008 | -4.4 | -1.2 |
| Q3-2008 | -2.4 | 0.5 |
| Q2-2008 | 0.0 | 1.7 |
| Q1-2008 | 1.6 | 2.5 |
| Q4-2007 | 2.4 | 3.1 |
| Q3-2007 | 2.8 | 3.5 |
by Tom Moeller February 11, 2010
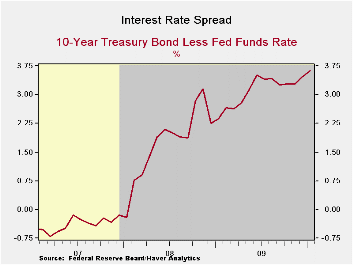 Injection
of
liquidity by the Federal Reserve into the banking system typically
raises inflationary concerns in the credit markets. And this time is no
different. Long-term interest rates have remained fairly stable as the
Fed funds rate has lingered near zero for over one year. The steepened
yield curve thus suggests a future inflationary problem.
Injection
of
liquidity by the Federal Reserve into the banking system typically
raises inflationary concerns in the credit markets. And this time is no
different. Long-term interest rates have remained fairly stable as the
Fed funds rate has lingered near zero for over one year. The steepened
yield curve thus suggests a future inflationary problem.
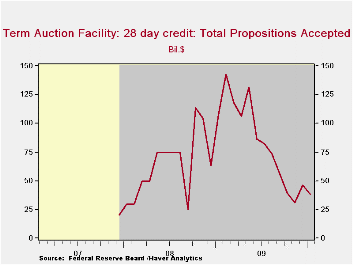
Not only has the Fed held interest rates low, it's provided liquidity to the banks, particularly through its Term Auction Facility (TAF). Through last year this provision fell as banks re-liquefied. But so far, it has not stimulated bank lending and money supply growth has decelerated sharply. Instead, the liquidity has been used to shore up balance sheets.
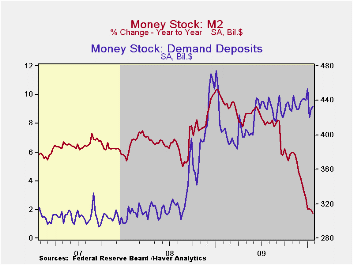
Indeed, money supply growth (M2) has decelerated as demand deposit balances have been flat since the middle of last year. Precaution remains the operative word for banks as they lend and also for individuals who remain cautious about job prospects.
The data referenced above can be found in Haver's WEEKLY database.
Interest on Required Balances and Excess Balances from the Federal Reserve Board is available here. Earlier this week, Chairman Bernanke indicated in Congressional testimony that the interest rate shown here would become a key tool in the Fed's liquidity management going forward. These data are also in Haver's WEEKLY database.
| Liquidity Measures | January | 2009 | 2008 |
|---|---|---|---|
| Reserve Bank Assets - Term Auction Facility | $3,8531M | $7,518 | $450,319 |
| Yield Curve (10 Yr. Treas. less Fed Funds) | 3.62% | 3.10% | 1.74% |
| Money Supply - Demand Deposits | -0.5% y/y | 24.4 % y/y | 11.3 |

Tom Moeller
AuthorMore in Author Profile »Prior to joining Haver Analytics in 2000, Mr. Moeller worked as the Economist at Chancellor Capital Management from 1985 to 1999. There, he developed comprehensive economic forecasts and interpreted economic data for equity and fixed income portfolio managers. Also at Chancellor, Mr. Moeller worked as an equity analyst and was responsible for researching and rating companies in the economically sensitive automobile and housing industries for investment in Chancellor’s equity portfolio. Prior to joining Chancellor, Mr. Moeller was an Economist at Citibank from 1979 to 1984. He also analyzed pricing behavior in the metals industry for the Council on Wage and Price Stability in Washington, D.C. In 1999, Mr. Moeller received the award for most accurate forecast from the Forecasters' Club of New York. From 1990 to 1992 he was President of the New York Association for Business Economists. Mr. Moeller earned an M.B.A. in Finance from Fordham University, where he graduated in 1987. He holds a Bachelor of Arts in Economics from George Washington University.
More Economy in Brief


