 Global| Oct 25 2007
U.S. Initial Claims for Jobless Insurance Remained High
by:Tom Moeller
|in:Economy in Brief
Summary
Initial claims for unemployment insurance remained high at 331,000 last week versus an upwardly revised level of 339,000 during the prior week. The decline in claims last week fell short of Consensus expectations for a decline of [...]
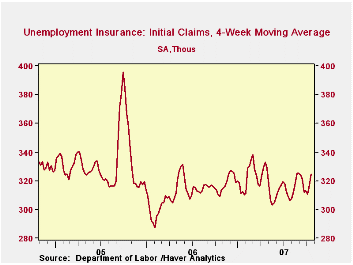
Initial claims for unemployment insurance remained high at 331,000 last week versus an upwardly revised level of 339,000 during the prior week.
The decline in claims last week fell short of Consensus expectations for a decline of 17,000 claims. The four week moving average of initial claims rose sharply to 324,750 (+5.0% y/y).
This month initial claims have averaged 326,000 per week, up 4.2% against an average of 313,000 during September.
A claims level below 400,000 typically has been associated with growth in nonfarm payrolls. During the last six years there has been a (negative) 78% correlation between the level of initial claims and the m/m change in nonfarm payroll employment.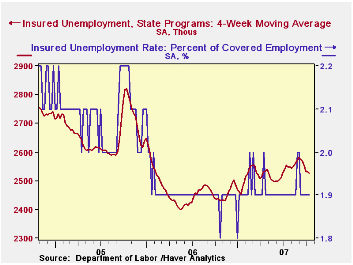
Continuing claims for unemployment insurance rose by 0.3% for second consecutive week. The increase during the prior week was downwardly revised.
The continuing claims numbers lag the initial claims figures by one week.
The insured rate of unemployment held steady at 1.9%, off the peaks in August of 2.0% which were reached for only two weeks during month-end.
| Unemployment Insurance (000s) | 10/20/07 | 10/13/07 | Y/Y | 2006 | 2005 | 2004 |
|---|---|---|---|---|---|---|
| Initial Claims | 331 | 339 | 6.8% | 313 | 331 | 343 |
| Continuing Claims | -- | 2,530 | 3.9% | 2,545 | 3.3% | 2,459 |
by Tom Moeller October 25, 2007
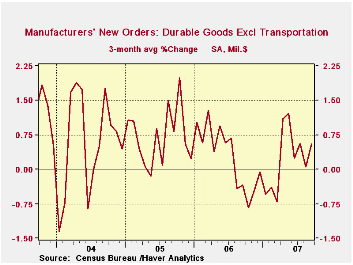
Durables goods orders fell sharply in September by 1.7% following a 5.3% drop during in August. That was revised slightly deeper from the initial report. Much of series' volatility is due to orders in the transportation sector. Excluding transportation (which still can be volatile), orders rose a slight 0.3% after an unrevised 1.8% decline during August.
The very short term trend in the non-transportation series shows some improvement, but that is due to a 3.3% jump back in July for which the latest two months' results can be viewed as a payback. But before that jump the longer term trend in orders growth was down, as was the trend in overall orders for durable goods.
Weakness in orders for electrical equipment, appliances and components most assuredly reflects weakness in the consumer sector. That also is true of computers where the latest three month growth recovered to a bare 1.6%, up from negative growth in the prior two periods and down from the peak in orders growth of 15.3% early his year.
To a limited degree, orders for nondefense capital goods less the very volatile aircraft component are holding up. These orders rose 0.4% last month after a 0.1% August decline. Three month growth of 0.4% is up from negative growth just recently and is a big recovery from the excessive declines between 1% and 2% early this year.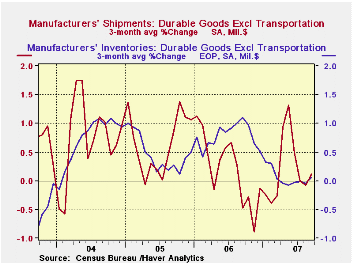
Machinery orders led that relative strength and rose 4.3% last month and the three month average growth is 5.5%. Orders for primary metals rose 1.6% and the average rise over the last three months also is an average 1.6%, up from negative growth earlier
Growth in shipments, however have weakened even more. Overall shipments growth is down to -0.0% on average over the last three months and less transportation it's +0.1%. That's versus growth rates over 1% earlier this year.
Inventories are lean. Average growth over the last three months totals only 0.1% versus average growth rates in excess of 1% late last year.
Unfilled orders also have picked somewhat to a recent average growth rate of 0.9% but that' down from 14.1% during all of 2006.
| NAICS Classification | September | August | Y/Y | 2006 | 2005 | 2004 |
|---|---|---|---|---|---|---|
| Durable Goods Orders | -1.7% | -5.3% | -6.6% | 6.3% | 9.9% | 5.3% |
| Excluding Transportation | 0.3% | -1.8% | 0.1% | 7.6% | 8.8% | 7.9% |
| Nondefense Capital Goods | 4.4% | -10.2% | -11.4% | 10.6% | 17.1% | 5.7% |
| Excluding Aircraft | 0.4% | -0.1% | .2% | 8.5% | 11.1% | 3.2% |
by Tom Moeller October 25, 2007
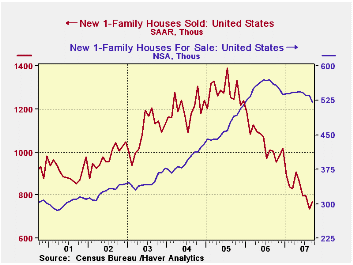
New single family home sales rose 4.8% last month and recovered much of the prior month's 7.9% m/m decline. Nevertheless, sales during the latest three months averaged 41.6% below the peak hit in the middle of 2005.
New home sales in July & August were revised down by roughly 8.0%.
In the West, sales recovered 37.7% last month after a 22.9% plunge during August. But the three month average is down an recessive 47.9% from the peak in mid-2005. Sales in the Northeast, which fell in September by 6.6%, are down 40.7% on average from the middle of 2005. Sales in the Midwest also fell in September by 19.5% and they actually led the pack with a 51.8% decline versus the 2005 peak. Sales in the South rose a small 0.5% in September and were off 43.9% from the 2005 peak.
According to CNN, David Seiders, chief economist for the home builders' trade group, indicated Thursday that the latest report has some questionable readings, including a 38 percent rise in sales in the West, which he expects will be revised significantly lower in subsequent months. Without that reported increase, sales would have fallen from the already weak revised level in August.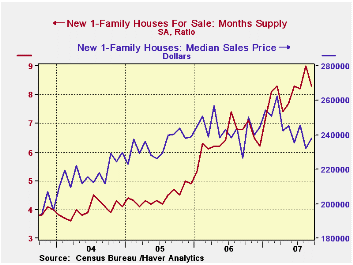
All this weakness in sales has done nothing for prices. They rose 2.5% in September but that only made half of the prior month's decline. It left prices down 9.4% from the peak earlier this year.
The number of homes for sale has surprisingly been falling of late, down 8.6% from the peak last year. But the number still is nearly double the level in early 2001. At the current sales rate, the months' supply of homes on the market rose to 8.3, also about double the low rate in 2005.
| US New Homes | September | August | Y/Y | 2006 | 2005 | 2004 |
|---|---|---|---|---|---|---|
| Total Sales (SAAR, 000s) | 770 | 735 | -23.3% | 1,049 | 1,279 | 1,201 |
| Median Price (NSA, $) | 238,000 | 232,100 | 5.0% | 243,067 | 234,208 | 217,817 |
by Robert Brusca October 25, 2007
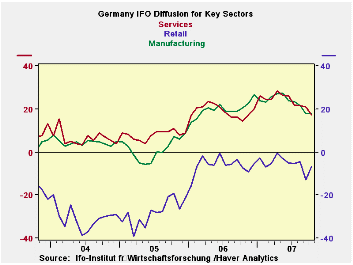
The IFO survey shows its various sectors to be well off peak. The overall index did slip again in October from +7.5 to +7.1. MFG, construction, wholesaling and services slipped on the month with only retailing getting a boost, but a big one, from -12.9 to -6.8. The all-sector index still resides at the door step of the top 20th percentile of the range. Among components only MFG is above the 80th percentile at 84.8%. Retail is the relative weakest sector at 56.4% of its range, followed by construction at 59.2% of its range. Wholesaling is at the edge of the top third of its range while the service sector is nearly in the top 25% of its range. The peaking of these indexes occurred around the end of the first quarter of this year. Retailing has hovered just short of neutral since that time. The ongoing rise in the Euro has cast a certain pall over the future.
On balance, these metrics are not bad at all. But they fall short of the strength the IFO report was exuding just a few short months ago… Germany then thought it was on top of the world. And maybe it was, but the world has since rolled over, impacting Germany’s relative position. /p>
The IFO Business climate index is near the top 20% of its range. The current situation is rated in the 82nd percentile (top 20 percent). But business expectations for the next six month are decidedly softer residing only in their 68th percentile.
Now all of these are above 50% and therefore above a point of neutrality. But they date from period back to 1992, a time span in which Germany did not do so well. So a finding of neutral, which would imply ‘average’ for this period, would not be very reassuring. Germany needs to do better than this average.
Risks… The hunter: captured by the game?The clear risk and problem at the moment is the ongoing rise of the euro. Some continue to warn of this current circumstance as putting the dollar at risk to a larger correction. We prefer to point out that the dollar cannot fall unless something else can rise. And the rise of the euro is already crimping German growth and its outlook along with that for other less competitive EMU members.
Let’s remember that since the early 1970s it is the countries where prices and exchange rates went up not down that had the biggest troubles: OPEC (with rising oil prices) and then Japan with the rising yen and still lingering traces of deflation. We wonder if the real risk here is that the euro might rise, more than that the dollar might fall.
The dollar is already at a relative low point and at some point, if it moves lower, buying interest in dollars will develop. But Germany’s economy will be hurt by a much stronger euro and that will prove a more troublesome issue for Germany and for the rest of the export oriented Europe. Whatever, they say, the cross border but within Euro area transactions (intra-union same currency exports and imports) are still vulnerable to international competition especially when the euro becomes overvalued. Germans may speak with the same currency as the French and Italians but their true language and culture is at least as different as is it is to that of Americans and Japanese. Cheap dollars or yen can get over any language barrier or common currency hurdle in a hurry.
| Summary of IFO Sector Diffusion readings | ||||||||
|---|---|---|---|---|---|---|---|---|
| CLIMATE Sum | Current | Last Mo | Since Jan 1991* | |||||
| Oct-07 | Sep-07 | Average | Median | Max | Min | Range | % Range | |
| All Sectors | 7.1 | 7.5 | -8.7 | -9.5 | 16.6 | -30.6 | 47.2 | 79.9% |
| MFG | 17.9 | 18.1 | -0.9 | 0.3 | 27.5 | -35.5 | 63.0 | 84.8% |
| Construction | -20.5 | -20.8 | -29.5 | -32.2 | 0.3 | -50.7 | 51.0 | 59.2% |
| Wholesale | 2.3 | 10.7 | -14.8 | -16.5 | 23.4 | -39.5 | 62.9 | 66.5% |
| Retail | -6.8 | -12.9 | -15.3 | -14.8 | 19.0 | -40.2 | 59.2 | 56.4% |
| Services | 17.2 | 20.8 | 8.7 | 8.2 | 28.5 | -15.7 | 44.2 | 74.4% |
| * May 2001 for Services | ||||||||
by Robert Brusca October 25, 2007
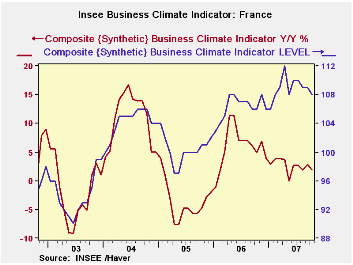
France’s industry survey from its statistical agency INSEE remains quite firm throwing off readings that are at the top one-third or higher of their respective ranges since 1990: Business climate, production, production trends, orders and demand - the whole lot of it remains firm. While the various readings have been slipping recently, in a broader sense, they have steadied at this top one-third of range mark, at a fairly firm level.
What is a touch less firm is INSEE’s assessment of the French MFG sector. A similar survey of just MFG shows the outlook for production at its 64th percentile and its trend at the 60th percentile. These are slightly weaker readings than for overall industry. The recent and likely trends for IP get stronger marks at 68Th percentile and 77TH percentiles, respectively. Orders and demand come in with readings at the 69th and 66th percentiles. On balance the French surveys for Industry and MFG remain on the firm side. MFG shows a touch more slippage than the overall.
Of course, there has been a lot of criticism from France recently over the exchange rate. A report I produced earlier in the week showed that within EMU France had gained competitiveness Vs the general EMU level but was lagging Germany by a significant amount. As the euro remains strong or becomes stronger this positioning could be a factor in how the French economy performs.
The chart at the top reminds us of two things. The first is that the French index is off peak. The second is that the Yr/Yr gain in the index has dissipated almost entirely. That suggests that there is almost no further upward momentum to the growth rate, not that the industry or MFG growth rates themselves will not remain positive.
| INSEE Industry Survey | ||||||||||
|---|---|---|---|---|---|---|---|---|---|---|
| Since Jan 1990 | Since Jan 1990 | |||||||||
| Oct 07 |
Sep 07 |
Aug 07 |
Jul 07 |
%tile | Rank | Max | Min | Range | Mean | |
| Climate | 108 | 109 | 109 | 110 | 70.0 | 49 | 123 | 73 | 50 | 101 |
| Production | ||||||||||
| Recent Trend | 9 | 6 | 11 | 17 | 65.7 | 61 | 44 | -58 | 102 | -6 |
| Likely Trend | 33 | 32 | 33 | 31 | 68.8 | 18 | 63 | -33 | 96 | 7 |
| Orders/Demand | ||||||||||
| Orders & Demand | -1 | 1 | 1 | 2 | 70.1 | 42 | 25 | -62 | 87 | -15 |
| Fgn Orders & Demand | 4 | 10 | 8 | 6 | 69.7 | 51 | 31 | -58 | 89 | -11 |
| Prices | ||||||||||
| Likely Sales Prices Trend | 9 | 13 | 11 | 9 | 68.1 | 30 | 24 | -23 | 47 | 0 |
by Tom Moeller October 25, 2007
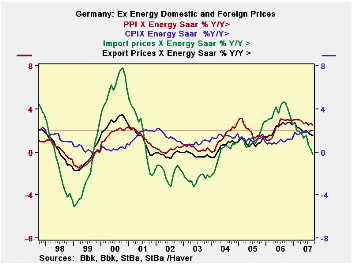
Domestic inflation is the more nettlesome here…
The less than one year in duration statistics in the table below are not as meaningful for export and import prices as they are not seasonally adjusted. But overall the trends in the table and in the chart show that inflation is in pretty good shape. Nonpetroleum inflation is keeping its head down. The reference line on the chart drawn at 2% shows that only the nonpetroleum PPI and CPI prices are edging above it. History shows us that when international prices turn lower that does not translate quickly into domestic prices becoming calm. In 2001 when import prices fell sharply it took about one year before the domestic ex-energy CPI responded.
Of course what happens with oil prices and with food prices does matter. We focus on ex energy prices mostly to rid ourselves of the volatility, but at the same time we see that it provides coherence in the relationships among domestic and international prices of various sorts.
| German International and Domestic Inflation Trends | |||||||
|---|---|---|---|---|---|---|---|
| % m/m | % Saar | ||||||
| SA: | Sep-07 | Aug-07 | Jul-07 | 3-Mo | 6-Mo | 12-Mo | Yr-Ago |
| Export Prices | -0.1% | 0.1% | -0.1% | -0.4% | 1.3% | 1.6% | 2.3% |
| Import Prices | 0.6% | -1.3% | 0.1% | -2.6% | 3.2% | 1.3% | 3.7% |
| NSA | |||||||
| Exp excl Petrol | 0.0% | 0.0% | 0.1% | 0.4% | 1.1% | 1.5% | 2.5% |
| Imp excl Petrol | -0.2% | -0.1% | -0.4% | -2.7% | -0.8% | -0.2% | 4.6% |
| Memo: SA | |||||||
| CPI | 0.3% | 0.1% | 0.3% | 2.5% | 2.7% | 2.4% | 1.0% |
| CPI excl energy | 0.3% | 0.2% | 0.2% | 2.6% | 2.4% | 2.0% | 1.0% |
| PPI | 0.1% | 0.2% | -0.1% | 0.7% | 1.7% | 1.5% | 5.1% |
| PPI excl Energy | 0.0% | 0.4% | 0.1% | 1.8% | 2.7% | 2.5% | 2.9% |
by Carol Stone October 25, 2007
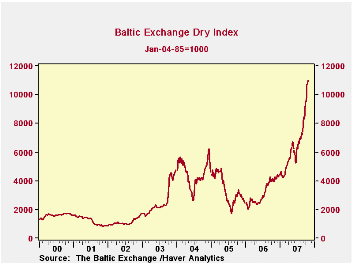
"Cost, insurance and freight" is an expression to describe the value of imports. The vast majority of the time, the "insurance and freight" portion amounts to a statistical discrepancy, used, at least by economists, merely to distinguish definitions of each measure of imports. However, the latter item in the expression is no long a trivial matter. The Wall Street Journal on Monday and then a client query called our attention to the Baltic Exchange Freight Indexes, the world's key gauge of freight charges. These have been soaring.
On October 24, the broadest measure, the Baltic Exchange Dry Index reached 10984 (January 4, 1985 = 1000), up a whopping 20.9% just since September 24. Actually, the most recent few days have seen some moderation, but the week of October 8-12 experienced daily hikes ranging from 1.4% to 3.6% each. The index stands an incredible 177.4% ahead of a year ago.
The Baltic Dry Index is a composite of the Baltic Capesize, Baltic Panamax and Baltic Supramax Indexes. Each covers a different group of sea routes around the world, different size and weight of ship and specialization of freight. The common element in these is that all of this freight is raw materials: grain, iron ore, coal, cement and other building materials, among others. Thus, when it becomes as significant as it is presently, it becomes key because it hits at the beginning of the production chain.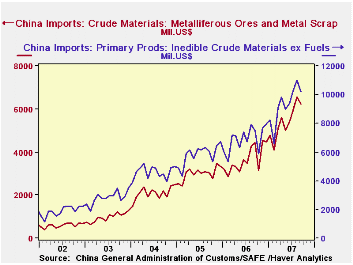
Several recent press accounts have highlighted the role of demand in China. The other day here, Louise Curley talked about the hints of some slowing in Chinese imports; their growth has tapered somewhat, particularly from neighbors Singapore and Korea. At the same time, detail reported today for September's imports show continued strength in just the raw materials that the Baltic Indexes cover. "Crude materials" inflows were $10.2 billion, up 36.3% from a year ago; Q3 as a whole saw 42.5% expansion. Within this category -- which excludes fuels so is not impacted by oil prices -- ferrous ores and metal scrap surged 40.9% from September 2006 to $6.2 billion; for those items, Q3 was 54.4% ahead of last year's period. The anecdotal evidence cites increasing shipments from Brazil as feeding this demand, as well as other producers. Those heavy volumes also feed the freight indexes, since ships must make longer trips and resulting port congestion means they must wait some days to unload, which also increases the cost.
The cause, some reports argue, is a shortage of ships, which, of course, have long building lead-times. By 2009, there will be a number of new freighters and container ships to bring some relief. A long time to wait.
These data are contained in Haver's BALTIC database, a proprietary database from the London-based Baltic Exchange. The Exchange is a clearinghouse of world shipping information.
| Oct 24 | Oct 23 | Week Oct 19 | Sept | June | Dec 2006 | Year Ago | |
|---|---|---|---|---|---|---|---|
| Baltic Exchange Dry Index, 01/04/85 =1000 | 10984 | 10944 | 10752 | 8574 | 5772 | 4336 | 3978 |
| Baltic Capesize Index, 03/01/99 = 1000 | 15487 | 15514 | 15361 | 11856 | 7616 | 5858 | 5404 |
| China Imports, Mil.$ | -- | -- | -- | -- | -- | -- | Sept '06 |
| Crude Materials, Inedible | -- | -- | -- | $10212 | $9355 | $7954 | $7492 |
| Ferrous Ores & Metal Scrap | -- | -- | -- | $6234 | $5408 | $4483 | $4425 |

Tom Moeller
AuthorMore in Author Profile »Prior to joining Haver Analytics in 2000, Mr. Moeller worked as the Economist at Chancellor Capital Management from 1985 to 1999. There, he developed comprehensive economic forecasts and interpreted economic data for equity and fixed income portfolio managers. Also at Chancellor, Mr. Moeller worked as an equity analyst and was responsible for researching and rating companies in the economically sensitive automobile and housing industries for investment in Chancellor’s equity portfolio. Prior to joining Chancellor, Mr. Moeller was an Economist at Citibank from 1979 to 1984. He also analyzed pricing behavior in the metals industry for the Council on Wage and Price Stability in Washington, D.C. In 1999, Mr. Moeller received the award for most accurate forecast from the Forecasters' Club of New York. From 1990 to 1992 he was President of the New York Association for Business Economists. Mr. Moeller earned an M.B.A. in Finance from Fordham University, where he graduated in 1987. He holds a Bachelor of Arts in Economics from George Washington University.
More Economy in Brief


