 Global| Nov 17 2008
U.S. Industrial Production Rebounds Modestly After Hurricanes
by:Tom Moeller
|in:Economy in Brief
Summary
Industrial production recovered 1.3% last month after its 3.8% plummet during September when production was depressed by Hurricanes Gustav & Ike. September output was also held down by a strike at Boeing. Consensus expectations had [...]
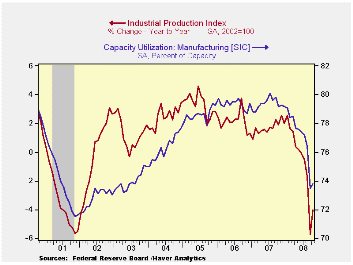
Industrial production recovered 1.3% last month after its 3.8% plummet during September when production was depressed by Hurricanes Gustav & Ike. September output was also held down by a strike at Boeing. Consensus expectations had been for no change in output last month.
During each of the last two months, the Fed indicated that industrial output fell 0.7%, excluding the hurricanes (which reduced mining output by 6.1%) and the strike.
Factory output recovered a modest 0.6% after falling 3.7%
during September. Output of consumer goods recovered all of its 1.2%
September drop but it was still off 2.8% y/y. Production of motor
vehicles & parts dropped 3.5% (-18.4% y/y) but, excluding
autos, output was still depressed. It recovered a modest 0.8% following
the 4.0% plunge during September. Nonetheless, a 4.3% decline in
factory output year-to-year compares to 2.0% growth during all of last
year.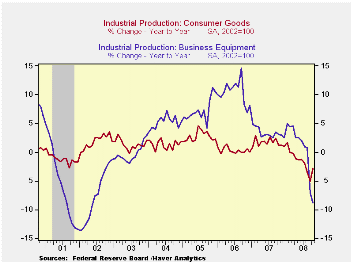
Industrial production in the high-tech sector is in a retrenchment mode. Output there fell 0.9% during October and that was the third consecutive monthly decline. And production was up just 9.9% y/y, the weakest gain since early 2005. Less both autos and high-tech, output inched up 0.2% last month following the 3.7% September plunge (-5.6% y/y).
The industry detail further reflected recession in the factory sector. Output of furniture & related products fell 2.9% last month for a 16.3% y/y decline. That was the largest y/y drop since the recession of 1975. Machinery production also reflected recession and it was down 1.7% (-6.9% y/y). A somewhat brighter spot was the 0.6% increase in electrical equipment production which left it down just 0.9% year-to-year. Apparel output, in the "recession-resistant" nondurables sector fell just 1.8% (-2.5% y/y. Production of chemicals recovered 5.1% after the 8.3% plunge due to the hurricanes. Reflecting the aftermath of the hurricanes was a 9.9% jump in output of petroleum & coal which recovered an 8.5% plummet.
Capacity utilization recovered to 76.4% which was still near its lowest level since 2003. Utilization in the factory sector of 73.8% also was near the lowest since 2003.
| INDUSTRIAL PRODUCTION (SA, %) | October | September | Y/Y | 2007 | 2006 | 2005 |
|---|---|---|---|---|---|---|
| Total Output | 1.3 | -3.8 | 1.3 | 1.7 | 2.2 | 3.3 |
| Manufacturing | 0.6 | -3.7 | 0.6 | 1.7 | 2.4 | 4.0 |
| Consumer Goods | 1.4 | -1.2 | -2.8 | 1.7 | 0.3 | 2.8 |
| Business Equipment | -2.2 | -7.1 | -8.8 | 3.3 | 10.4 | 7.3 |
| Construction Supplies | -1.1 | -1.9 | -6.9 | -2.5 | 2.2 | 4.5 |
| Utilities | 0.4 | 2.5 | -0.6 | 3.3 | -0.6 | 2.1 |
| Capacity Utilization | 76.4 | 75.5 | 80.8 | 81.0 | 80.9 | 80.2 |
by Tom Moeller November 17, 2008
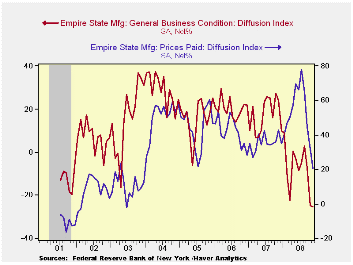
The November Empire State Index of manufacturing actor activity as reported by the Federal Reserve Bank of New York fell to -25.43 which, for the series' short eight year history, was a record low. The decline was just modest versus the October level but it was down sharply from an average of -3.19 during the third quarter. A November reading of -26.1 for had been the Consensus expectation.
The figure is a diffusion index. Since the series' inception in 2001 there has been a 58% correlation between its' level and the three-month change in U.S. factory sector industrial production.
The index of pricing pressure also fell fell sharply to 20.48.
The ten point decline from October was to the lowest level since
December of 2003. Since inception in 2001 there has been an 81%
correlation between the index of prices paid and the three-month change
in the core intermediate materials PPI.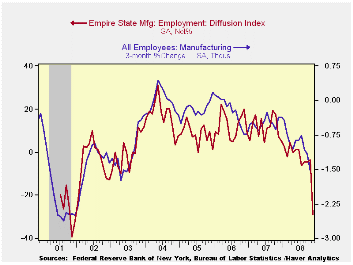
The indexes for new orders, shipments and unfilled orders each fell but the delivery times component ticked higher.
The employment index also fell during November dropping sharply to its lowest level since late 2001, negative for the fifth consecutive month. In the history of the NY employment index, there has been an 86% correlation between it and the three-month growth in overall factory sector employment.
Like the Philadelphia Fed Index of General Business Conditions, the Empire State Business Conditions Index reflects answers to an independent survey question; it is not a weighted combination of the components.
The Empire State index of expected business conditions in six months fell to 13.02 which was its lowest since 2001. The subseries for shipments and employment jumped and the pricing series fell to its lowest level in twelve months.
The Empire State Manufacturing Survey is a monthly survey of manufacturers in New York State conducted by the Federal Reserve Bank of New York. Participants from across the state in a variety of industries respond to a questionnaire and report the change in a variety of indicators from the previous month. Respondents also state the likely direction of these same indicators six months ahead.
For more on the Empire State Manufacturing Survey, including methodologies and the latest report, click here.
| Empire State Manufacturing Survey | November | October | November '07 | 2007 | 2006 | 2005 |
|---|---|---|---|---|---|---|
| General Business Conditions (diffusion index, %) | -25.43 | -24.62 | 24.05 | 17.23 | 20.24 | 15.53 |
| Prices Paid | 20.48 | 31.71 | 47.37 | 35.64 | 41.88 | 44.74 |
by Louise Curley November 17, 2008
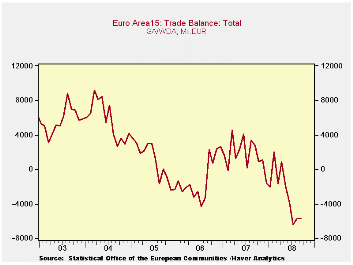
The Euro Areatrade balance in September was -5,742 million euros virtually unchanged fromthe -5,705 million euros in August. It was, however, 8,549 million euros below the trade surplus of 2,807 million euros in September 2007. Since December 2007, the trade balance in the Euro Area has, more often than not, been negative. The largest deficit of 6,387 million euros was recorded in July of this year, as can be seen in the first chart.
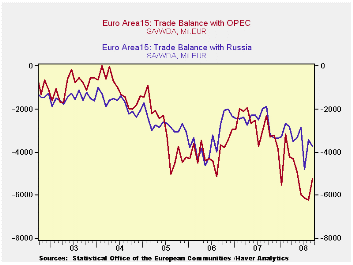
 Both high oil prices and a rising euro led to the
deterioration in the trade balance. High oil prices accounted for much
of the increasing trade deficits with Russia and OPEC earlier this
year. With the recent decline in the price of oil, the trade balance
with OPEC has become less negative. The trade balances with Russia and
OPEC are shown in the second chart.
Both high oil prices and a rising euro led to the
deterioration in the trade balance. High oil prices accounted for much
of the increasing trade deficits with Russia and OPEC earlier this
year. With the recent decline in the price of oil, the trade balance
with OPEC has become less negative. The trade balances with Russia and
OPEC are shown in the second chart.
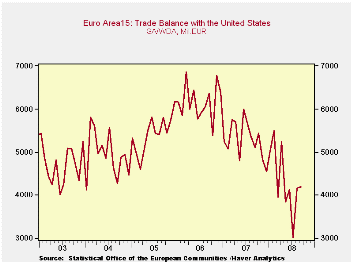
The rising euro has dampened exports to and encouraged imports
from trading partners, leading to smaller surpluses or larger deficits.
For example, the Euro Area's trade surplus with the United States has
fallen sharply over the last year and a half, as shown in the third
chart.
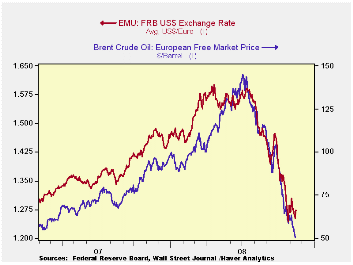
The price of oil and the value of the euro declined dramatically in recent months as the global financial crisis spread to more countries and intensified. The daily price of oil and the daily value of the euro are shown in the fourth chart. While the decline in the price of oil should reduce the Euro Area's imports, the effect of the decline in the euro is less predictable. Although it should be good for exports, falling world demand could outweigh the positive effects of the lower euro.
| EURO AREA 15 TRADE BALANCES | Sep 08 | Aug 08 | Sep 07 | M/M chg | Y/Y chg | 2007 | 2006 | 2005 |
|---|---|---|---|---|---|---|---|---|
| TOTAL | -5742 | -5705 | 2807 | -36 | -8549 | 20384 | -13049 | 10744 |
| With United States | 4197 | 4160 | 5098 | 37 | -901 | 63525 | 73914 | 65239 |
| With Russia | -3729 | -3429 | -1891 | -299 | -1837 | -30843 | -40429 | -32676 |
| With OPEC | -5235 | -6226 | -2286 | 981 | -2949 | -33532 | -48010 | -36611 |
by Robert Brusca November 17, 2008
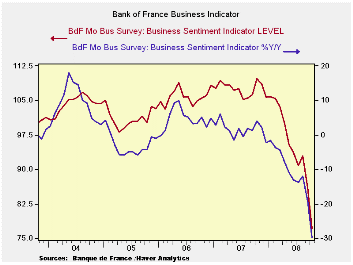
The Bank of France Industry Sentiment Index is pointing much lower. At 77.14 it has fallen in October from 86.08 the month before. This compares to its 12-month average of 97. The index is weaker than this level only about 2 percent of the time. The latest production and production outlook indices are at bottom-scraping levels. Foreign orders and new industry orders are both at their lowest level since 1987. The hiring outlook is worse only about 20% of the time.
It is no wonder that, armed with this survey result, French Finance Minister Christine Lagarde warned on the outlook. All of Europe is crumbling under the strain.
| Bank of France Monthly INDUSTRY Survey: SUMMARY | ||||||
|---|---|---|---|---|---|---|
| 12 MO | Since Jan-87 | Percentile | ||||
| Oct-08 | Sep-08 | Aug-08 | AVERAGE | Average | rank/range | |
| Production-Latest Month | ||||||
| Total Industry | -23.53 | -20.09 | 8.2 | -2 | 7 | 0.06 |
| Production Outlook | ||||||
| Total Industry | -18 | -9 | 0 | 4 | 15 | 0.0% |
| Demand | ||||||
| Overall Order Books | -22.61 | -6.61 | -2.17 | 10 | 4 | 22.5% |
| Foreign Orders | -33.2 | -28.65 | -5.85 | -3 | 8 | 0.0% |
| New Orders | ||||||
| Total Industry | -35.36 | -32.17 | -1.49 | -3 | 8 | 0.0% |
| Stocks: Finished Goods | ||||||
| Total Industry | 3.62 | 0.35 | 1.26 | 0 | -2 | 80.7% |
| Capacity Utilization | 77.87 | 79.9 | 80.47 | 82 | 83 | 3.4% |
| Hiring | ||||||
| Latest Month | -12.12 | -6.62 | -2.27 | -3 | -1 | 20.6% |
| Outlook | -16.19 | -9.93 | -4.2 | -5 | -4 | 22.8% |
| Industry Sentiment Index | 77.14 | 86.07 | 92.92 | 97 | 102 | 2.3% |

Tom Moeller
AuthorMore in Author Profile »Prior to joining Haver Analytics in 2000, Mr. Moeller worked as the Economist at Chancellor Capital Management from 1985 to 1999. There, he developed comprehensive economic forecasts and interpreted economic data for equity and fixed income portfolio managers. Also at Chancellor, Mr. Moeller worked as an equity analyst and was responsible for researching and rating companies in the economically sensitive automobile and housing industries for investment in Chancellor’s equity portfolio. Prior to joining Chancellor, Mr. Moeller was an Economist at Citibank from 1979 to 1984. He also analyzed pricing behavior in the metals industry for the Council on Wage and Price Stability in Washington, D.C. In 1999, Mr. Moeller received the award for most accurate forecast from the Forecasters' Club of New York. From 1990 to 1992 he was President of the New York Association for Business Economists. Mr. Moeller earned an M.B.A. in Finance from Fordham University, where he graduated in 1987. He holds a Bachelor of Arts in Economics from George Washington University.
More Economy in Brief


