 Global| Jun 27 2008
U.S. Income Surged Due to Stimulus Payment
by:Tom Moeller
|in:Economy in Brief
Summary
Nominal personal income surged 1.9% during May as the government's tax rebate checks began to be mailed out. The gain by far exceeded Consensus expectations for a 0.4% increase, although excluding rebates income rose just 0.4%. [...]
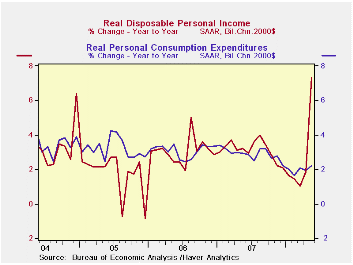
Nominal personal income surged 1.9% during May as the government's tax rebate checks began to be mailed out. The gain by far exceeded Consensus expectations for a 0.4% increase, although excluding rebates income rose just 0.4%.
Disposable personal income also surged. The 5.7% month-to-month jump lifted the three-month growth rate to 28.2% (AR), the fastest since early-1975.
Wage & salary income rose a lesser 0.3% (4.6% y/y) after a 0.1% decline during April. As a result of weakness in the monthly gains, the annualized three-month growth in wages amounted to just 2.7% versus a 5.8% rise during all of last year. Factory sector wages rose 0.1% (1.8% y/y) after a downwardly revised 0.4% April decline. Wages & salaries in the private service-providing industries rose 0.3% (+5.2% y/y) after a slight 0.1% dip in April. Wages in the government sector rose 0.3% (5.1% y/y) but three-month growth fell to 4.1%.
Interest income fell 0.3% (+0.1% y/y) for the eighth straight month of decline. The flat reading for y/y growth follows 5% to 14% growth during each of the prior three years. Dividend income rose a firm 0.6% (9.7% y/y) but here too growth is well below that of the prior four years.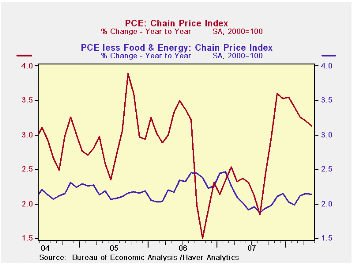
The PCE chain price index doubled expectations with a 0.4% increase, driven by a 0.8% rise in nondurables (energy) prices. The core PCE price index, however, fell short of Consensus forecasts and rose just 0.1%. That continued weakness left the three-month growth in core prices at 1.8%, its weakest since the middle of last year. Easier or stable gains have been registered for goods prices, however, services prices grew at a firmer 4.0% annual rate during the last three months, nearly double the growth at the middle of last year.
Personal consumption expenditures surged 0.8% last month, driven higher by the rise in gasoline prices. Adjusted for price inflation, real spending still was firm and rose 0.4%, the strongest increase since August of last year. The gain lifted the three-month rate of increase to 3.1% (AR).
Though annualized growth in spending on motor vehicles was negative over the last three months, spending elsewhere strengthened. Real spending on furniture soared at a 15.4% rate, apparel spending jumped at a 10.5% rate and real growth in spending on gasoline & oil (if you can believe it) jumped at a 14.5% rate. Recreation spending also grew at an accelerated 4.4% during the last three months. These and other detailed spending figures are available in Haver's USNA database.
The personal savings rate surged to 5.0% as a result of the rebate checks not having all been spent.
| Disposition of Personal Income (%) | May | April | Y/Y | 2007 | 2006 | 2005 |
|---|---|---|---|---|---|---|
| Personal Income | 1.9 | 0.3 | 6.4 | 6.2 | 6.6 | 5.9 |
| Disposable Personal Income | 5.7 | 0.4 | 10.7 | 5.7 | 5.9 | 4.7 |
| Personal Consumption | 0.8 | 0.4 | 5.4% | 5.5 | 5.9 | 6.2 |
| Saving Rate | 5.0 | 0.4 | 0.2 (May '07) | 0.5 | 0.4 | 0.5 |
| PCE Chain Price Index | 0.4 | 0.2 | 3.1 | 2.5 | 2.8 | 2.9 |
| Less food & energy | 0.1 | 0.1 | 2.1 | 2.1 | 2.2 | 2.2 |
by Tom Moeller June 27, 2008
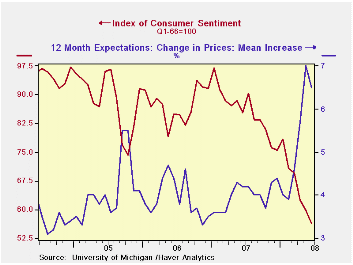
The final reading of June consumer sentiment from the University of Michigan fell 5.7% from May to a level of 56.4. The decline was slightly greater-than-expected and it pulled sentiment 42% below the latest peak in early-2007.
During the last ten years there has been a 47% correlation between the level of sentiment and the three month change in real consumer spending.
The June current conditions index dropped 7.8% (-33.7% y/y) and the view of current personal finances dropped 13.7% (-37.3% y/y). The index of whether now is a good time to buy large household goods reversed an initial read of improvement and fell 4.6% (-32.5% y/y).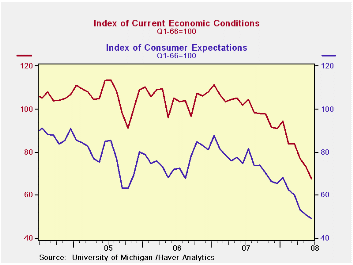
The expectations component of overall sentiment fell 3.7%, about the same as it did in May. The index fell to its lowest level since late-1990. Expectations for personal finances dropped the same 2.0% (-17.9% y/y) as it did in May. It was the lowest level since 1980 while expectations for business conditions during the next five years also fell sharply to the lowest level since 1991.
Opinions about government policy, which apparently influence economic expectations, reversed the May plummet and the index improved increased 21.6% after a like decline in May.
The mean expected rate of inflation during the next twelve months fell to 6.5% after the surge last month to 7.0%. During the next five years the expected inflation rate held steady at 4.0%.
The University of Michigan survey is not seasonally adjusted.The reading is based on telephone interviews with about 500 households at month-end; the mid-month results are based on about 300 interviews. The summary indexes are in Haver's USECON database, with details in the proprietary UMSCA database.
| University of Michigan | June (Final) | June (Prelim. | May | April | June y/y | 2007 | 2006 | 2005 |
|---|---|---|---|---|---|---|---|---|
| Consumer Sentiment | 56.4 | 56.7 | 59.8 | 62.6 | -33.9% | 85.6 | 87.3 | 88.5 |
| Current Conditions | 67.6 | 68.7 | 73.3 | 77.0 | -33.7% | 101.2 | 105.1 | 105.9 |
| Expectations | 49.2 | 49.0 | 51.1 | 53.3 | -34.1% | 75.6 | 75.9 | 77.4 |
by Robert Brusca June 27, 2008
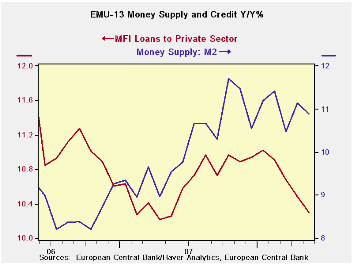
Money growth is slowing on a gradual pace. In EMU credit
growth is slowing more rapidly, undoubtedly helped along by banks’ own
credit tightening moves.
The table shows that nominal money supply growth rates are
slowly deteriorating in various key money-center countries. The growth
in real balances (inflation adjusted money and credit amounts) is
decelerating faster than for nominal balances as the domestic price
level has shot up across all these nations even as nominal money growth
has slowed. We show the increase in the price of oil (WTI) to the far
right of the table.
Money and credit slow…
In EMU money and credit real balance growth (bottom of the table) is in
the 4% to 5% range over three months compared to the 7% to 8% range
over 12-months. In the US, the UK and Japan money growth is in the 0.5%
to 2% range over three months. In each case there is a deceleration
from the 12-month pace that is significant. These are growth-impeding
polices.
Policy risks may not be what they seem…
A slowing stimulus from real balances will help to slow growth in these
countries. Meanwhile, the myriad factors that remain in play from high
energy prices to banking sector problems continue to crimp growth. At
this point real money balances are simply slowing but their growth
rates remain positive. Still, there could be a substantial dose of
slowing that is in the pipeline from current policy restrictiveness due
to sluggish real balance growth let alone any tighter policy.
Still central banks are focused on interest rates and real
interest rates as they struggle to keep inflation expectations
‘anchored’. The ECB that places more weight on money and credit
aggregates than does the Fed in the US has the aggregates that are
growing the fastest even when adjusted for the effects of inflation.
The ECB is preparing to hike rates, a move that should further slow
money and credit growth there and could pressure other countries to
follow suit event though they seem farther along the road to credit
restrictiveness than the ECB – despite the fact that other countries
have cut rates when the ECB has not.
Too easy or too tight?
Based on the actual slowing of real balances the risk of being too
tight with policy seems quite plausible despite the obvious worry in
the tone from central banks that are concerned with inflation that is
over the top of its target ceiling or guideline. Slippage in inflation
expectations is not a price that any central bankers are wiling to pay.
But the policy risk now may be turning to the potential for overkill on
the side of restrictiveness when the credit crunch and depressing
effect of oil prices are both fully accounted for. Don’t look for it in
many central bank speeches, however. So far, only the UK’s Mervyn King
has said explicitly that to get control of inflation will require
slowing growth. He had previously said that controlling inflation would
involve pain. In the US its dual mandate does not allow the Fed
purposefully dish out pain to slow inflation. So look for the Fed’s
analysis of the economy to be too-cheery in order to permit it to be
tighter than it needs to be. The Fed is already cheerily saying that
spending has firmed, while it has jettisoned language about expecting
oil prices to flatten or fall yet it still expects inflation to fall.
Nice if you can get it. But will it be that simple?
| Look at Global and Euro Liquidity Trends | |||||||
|---|---|---|---|---|---|---|---|
| Saar-all | Euro Measures (E13): Money & Credit | G-10 Major Markets: Money | Memo | ||||
| €€-Supply M2 | Credit: Residential |
Loans | $US M2 | ££UK M4 | ¥¥Jpn M2+Cds | OIL:WTI | |
| 3-MO | 9.2% | 9.0% | 8.5% | 5.5% | 7.3% | 0.7% | 203.4% |
| 6-MO | 10.0% | 10.9% | 9.8% | 7.9% | 10.8% | 2.0% | 73.0% |
| 12-MO | 10.9% | 12.0% | 10.3% | 6.3% | 10.1% | 2.0% | 96.5% |
| 2Yr | 10.2% | 11.4% | 10.3% | 6.3% | 12.0% | 1.7% | 32.8% |
| 3Yr | 9.9% | 11.7% | 10.8% | 5.8% | 11.8% | 1.6% | 35.9% |
| Real Balances: deflated by Own CPI. Oil deflated by US CPI | |||||||
| 3-MO | 4.9% | 4.7% | 4.2% | 0.6% | 2.2% | 0.7% | 189.2% |
| 6-MO | 6.2% | 7.2% | 6.1% | 3.7% | 5.9% | 1.6% | 66.3% |
| 12-MO | 7.0% | 8.0% | 6.4% | 2.2% | 6.5% | 1.2% | 88.8% |
| 2Yr | 7.2% | 8.4% | 7.3% | 2.8% | 8.7% | 1.3% | 28.4% |
| 3Yr | 7.1% | 8.8% | 7.9% | 2.1% | 8.9% | 1.3% | 31.2% |
by Robert Brusca June 27, 2008

Setting the tone: The EU sentiment indices set the tone for the month's upcoming reports. Overall EU sentiment, with its sharp drop over the past three months now resides below the mid point of its range in the 49.8th percentile and is about 5.5% below is average. Despite a raw negative reading, the industrial index is above its midpoint at the 67th range percentile; it edged one point lower in the month. Consumer confidence at -17 also fell in the month and is in its 34th range percentile. Retail's reading fell but remains above the April low. It stands in the 59th percentile of its range and is right at is period average. The raw construction sector reading slipped in the month. It stands in the 62nd percentile of its range. The service sector carries a positive reading and did notch up this month but still stands in weak stead, in the 34th percentile of its range.
Countries are having differing experiences: Overall country ratings find Germany's sentiment is the 67th percentile of its range, a still firm reading (top third). France's sentiment stands in the 57th percentile of its range. For EMU as a whole the range standing is just below its mid-point at 49.7. Italy is in its 47th range percentile. Spain is very weak at its 12th overall range percentile. Spain tends to be least correlated with the EU index among these countries. Italy, despite its relative weakness is showing some rebound as its Yr/Yr sentiment gauge is dropping with noticeable deceleration.
Trends differ too: One balance these are weak readings for Europe. They are not recessionary as the main drivers for growth are showing relatively firm results. But the UK, an EU member has slipped below the mid point of its overall sentiment range. Italy has been there, too, but actually has slowed is rate of descent. Spain is very weak with the Zone's worst property market and, therefore, the most to lose from an ECB rate hike. Meanwhile Germany and France are supporting the EU readings. But in France consumer confidence has been falling and Germany has been undergoing erosion in confidence and in MFG measures.
All the usual Bug-a-boos still haunt growth prospects: The usual culprits are still beating on these economies. High energy prices threaten, rate hikes from the ECB are awaited, too-high inflation lingers, financial turmoil persists, real estate problems dog some members more than others, and under capitalized banks are like a constant foot on the brake pedal... These are serious issues. And they have undermined consumer confidence across the board. To some extent Europe's export prowess has helped keep it aloft but that is being pressured as global growth slows and the euro has ticked back up. Now there is the new step up in oil prices to contend with. Europe is under pressure and with downward revisions to growth in several countries (made on Friday June 27th) the future for growth in EMU remains challenged. The Governor of the BOE, Mervyn King, has been the most outspoken in saying that growth will have to slow to rein in inflation. But how far is the BOE and how far is the ECB willing to go? These key lingering questions are the keys points in the current outlook and real uncertainties especially as inflation averse Germany notches an even higher preliminary CPI rate at 3.3% in June.
| EU Sectors and Country level Overall Sentiment | |||||||||||
|---|---|---|---|---|---|---|---|---|---|---|---|
| EU | Jun 08 |
May 08 |
Apr 08 |
Mar 08 |
%tile | Rank | Max | Min | Range | Mean | R-SQ w/ Overall |
| Overall | 94.6 | 97.1 | 98 | 101.9 | 49.8 | 156 | 116 | 73 | 43 | 100 | 1.00 |
| Industrial | -4 | -3 | -2 | 0 | 67.6 | 86 | 7 | -27 | 34 | -7 | 0.87 |
| Consumer Confidence | -17 | -14 | -12 | -11 | 34.5 | 192 | 2 | -27 | 29 | -10 | 0.83 |
| Retail Sales | -5 | -3 | -6 | 1 | 59.3 | 98 | 6 | -21 | 27 | -5 | 0.48 |
| Construction | -14 | -11 | -11 | -9 | 62.2 | 105 | 3 | -42 | 45 | -17 | 0.42 |
| Services | 7 | 6 | 6 | 11 | 34.2 | 101 | 32 | -6 | 38 | 16 | 0.81 |
| % m/m | Jun 08 |
Based on Level | Level | ||||||||
| EMU | -2.8% | 0.5% | -2.5% | 94.9 | 49.7 | 149 | 117 | 73 | 44 | 99 | 0.96 |
| Germany | -1.5% | 0.2% | -1.2% | 101.5 | 67.9 | 101 | 112 | 79 | 34 | 99 | 0.75 |
| France | -2.7% | -1.8% | -2.4% | 98.5 | 57.3 | 129 | 119 | 72 | 47 | 100 | 0.79 |
| Italy | -0.1% | 3.3% | -1.7% | 95.0 | 47.4 | 146 | 121 | 71 | 50 | 100 | 0.79 |
| Spain | -7.8% | -0.4% | -4.1% | 73.0 | 12.3 | 200 | 118 | 67 | 51 | 100 | 0.61 |
| Memo: UK | 2.3% | -5.4% | -8.5% | 92.7 | 44.6 | 172 | 118 | 72 | 46 | 101 | 0.45 |
| Since 1990 except Services (Oct 1996) | 222 | -Count | Services: | 126 | -Count | ||||||
| Sentiment is an index, sector readings are net balance diffusion measures | |||||||||||
Tom Moeller
AuthorMore in Author Profile »Prior to joining Haver Analytics in 2000, Mr. Moeller worked as the Economist at Chancellor Capital Management from 1985 to 1999. There, he developed comprehensive economic forecasts and interpreted economic data for equity and fixed income portfolio managers. Also at Chancellor, Mr. Moeller worked as an equity analyst and was responsible for researching and rating companies in the economically sensitive automobile and housing industries for investment in Chancellor’s equity portfolio. Prior to joining Chancellor, Mr. Moeller was an Economist at Citibank from 1979 to 1984. He also analyzed pricing behavior in the metals industry for the Council on Wage and Price Stability in Washington, D.C. In 1999, Mr. Moeller received the award for most accurate forecast from the Forecasters' Club of New York. From 1990 to 1992 he was President of the New York Association for Business Economists. Mr. Moeller earned an M.B.A. in Finance from Fordham University, where he graduated in 1987. He holds a Bachelor of Arts in Economics from George Washington University.
More Economy in Brief
 Global| Feb 05 2026
Charts of the Week: Balanced Policy, Resilient Data and AI Narratives
by:Andrew Cates


