 Global| May 30 2008
U.S. Income & Spending Rose Moderately in April; Real Income Flat
by:Tom Moeller
|in:Economy in Brief
Summary
Nominal personal income rose 0.2% last month after a 0.4% March increase which was revised up slightly from the initial report. The April rise matched Consensus expectations. Nevertheless, slower growth in payrolls slowed the rise in [...]
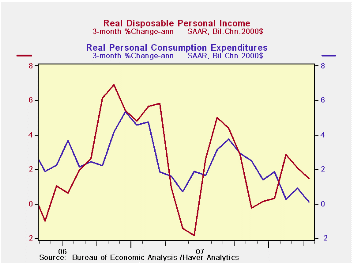
Nominal personal income rose 0.2% last month after a 0.4% March increase which was revised up slightly from the initial report. The April rise matched Consensus expectations. Nevertheless, slower growth in payrolls slowed the rise in income to a three-month growth rate of 4.2% after the 6.2% increase during all of last year.
Disposable personal income also rose a moderate 0.2% during April. Adjusted for price inflation, however, real income fell just slightly after no change in March. As a result of this recent and earlier weakness, the 1.5% three-month growth rate in real DPI was roughly half of that during all of 2007.
The PCE chain price index matched
expectations and increased 0.2% after a 0.3% rise in March. The core
PCE price index also matched expectations and ticked up just
0.1%. That weakness was enough to lower the three-month growth in core
prices to 1.8%, its weakest since the middle of last year.
Easier gains have been registered for goods prices but services prices
have grown at a firmer 3.7% annual rate during the last three months.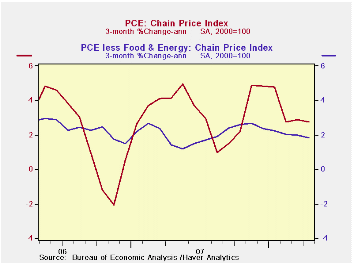
Wage & salary income fell 0.2% (+4.4% y/y) after a 0.5% March increase. As a result of the April decline the three-month growth in wages fell to 2.5%, half of last year's growth and still well reduced from the 10% rate of growth early in 2007 and late in 2006. Factory sector wages fell 0.7% (+1.1% y/y) and the decline reversed all of the gains during the prior three months. Wages & salaries in the private service-providing industries fell as well in April but remained relatively strong versus the goods producing sector. A 0.2% April drop (+5.1% y/y) pulled three-month growth to 3.2% or half the gain during 2007. Wages in the government sector rose 0.3% (4.9% y/y) for the second straight month and three-month growth of 4.5% was equal to last year's increase but it was down from the 7.3% growth during 1Q.
Interest income rose a modest 0.1% after lower interest rates had caused interest income to be flat or unchanged (+2.2% y/y) during the prior six months. That rise is down from 5% to 14% growth during each of the prior three years. Dividend income rose another firm 0.5% (10.3% y/y) and, again, a three-month gain of 7.2% is half, or more than half, the rates of growth during the prior four years.
Personal consumption expenditures rose just 0.2% last month or half the gain during March. Adjusted for price inflation, real spending fell just slightly in April and it has grown at a 0.1% annual rate during the last three months. That's after 2.9% growth in 2007 and much less than the 3.0% growth in each of the prior two years.
Real spending on discretionary items was mixed. Motor vehicle & parts purchases fell 2.3% last month and three-month growth plummeted further to -15.3%. In a reversal, real spending on household furniture & appliances surged 1.9%. That was the strongest increase since early 2006. Real spending on apparel grew another 0.5% and three-month growth held firm at 9.0%. These and other detailed spending figures are available in Haver's USNA database.
The personal savings rate improved slightly from the prior three year's average to 0.7%.
| Disposition of Personal Income (%) | April | March | Y/Y | 2007 | 2006 | 2005 |
|---|---|---|---|---|---|---|
| Personal Income | 0.2 | 0.4 | 4.8 | 6.2 | 6.6 | 5.9 |
| Disposable Personal Income | 0.2 | 0.3 | 5.0 | 5.7 | 5.9 | 4.7 |
| Personal Consumption | 0.2 | 0.4 | 4.8% | 5.5 | 5.9 | 6.2 |
| Saving Rate | 0.7 | 0.7 | 0.4 (April '07) | 0.5 | 0.4 | 0.5 |
| PCE Chain Price Index | 0.2 | 0.3 | 3.2 | 2.5 | 2.8 | 2.9 |
| Less food & energy | 0.1 | 0.2 | 2.1 | 2.1 | 2.2 | 2.2 |
by Tom Moeller May 30, 2008
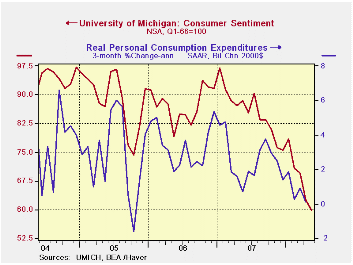
The final reading of consumer sentiment during May from the University of Michigan fell 4.5% from April to a level of 59.8. That was about as indicated in the preliminary report made two weeks ago and it nearly matched Consensus expectations. The latest level was the lowest since the brief "credit crunch" recession during 1980.
During the last ten years there has been a 47% correlation
between the level of sentiment and the three month change in real
consumer spending.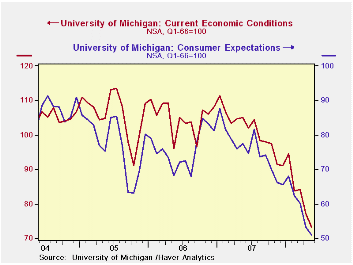
The current conditions index nearly matched the April decline and fell 6.9% after an 8.6% decline during April. The view of current conditions for buying large household goods fell a hard 6.3% (-34.4% y/y) and it was the third sharp m/m drop this year. Only 49% of respondents thought that now was a good time to buy versus 70%-plus during the last three years. Conversely, 44% thought it was a bad time to buy. That was the highest reading since 1990 and more than double the recent rates. The view of current personal finances fell to its lowest level since early 1981.
The expectations component of overall sentiment fell 3.0%
after its 11.3% April dive. The index fell to its lowest level since
late 1990. Expectations for personal finances fell slightly after a
sharp April decline to the lowest level since 1980. Expectations for
business conditions during the next year fell much more strongly by
12.5% (-63.9% y/y) to its lowest level since 1980. The index for
expected business conditions over the next five years also fell but
more mildly m/m (-21.3% y/y).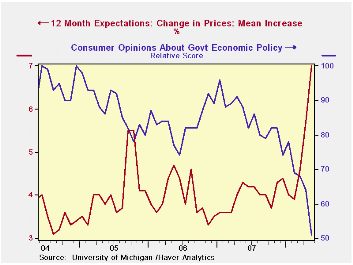
Opinions about government policy, which apparently influence economic expectations, still showed a sharp 21.9% m/m (-43.2% y/y) drop. The percentage of those surveyed who indicated that they thought government was doing a good job amounted to only 6% but those who thought a poor job was being done shot up to a record 56% from 43% in April.
The mean expected rate of inflation during the next twelve months surged to 7.0% from 5.7% in April, the highest level since 1981.Has the Behavior of Inflation and Long-Term Inflation Expectations Changed? from the Federal Reserve Bank of Kansas City can be found here.
The University of Michigan survey is not seasonally adjusted.The reading is based on telephone interviews with about 500 households at month-end; the mid-month results are based on about 300 interviews. The summary indexes are in Haver's USECON database, with details in the proprietary UMSCA database.
| University of Michigan | May (Final) | May (Prelim.) | April | March | May y/y | 2007 | 2006 | 2005 |
|---|---|---|---|---|---|---|---|---|
| Consumer Sentiment | 59.8 | 59.5 | 62.6 | 69.5 | -32.3% | 85.6 | 87.3 | 88.5 |
| Current Conditions | 73.3 | 71.7 | 77.0 | 84.2 | -30.3% | 101.2 | 105.1 | 105.9 |
| Expectations | 51.1 | 51.7 | 53.3 | 60.1 | -34.1% | 75.6 | 75.9 | 77.4 |
by Robert Brusca May 30, 2008
German retail sales are showing some real weakness in April.
Nominal sales ex-autos are off by 1.3% in April and 1.7% in real terms.
For the developing second quarter the results are grim. As of the first
month of the new quarter the growth rate of ex auto retail sales in
April over the Q1 base is at a minus 13.1% annualized growth rate for
nominal retail sales and -15.9% for inflation-adjusted retail sales.
The table shows a steady menu of negative growth rates over
all horizons from one year in, with the pace of declines getting more
or less progressively weaker.
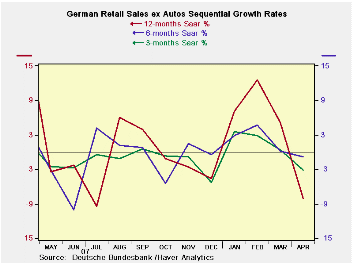
The chart shows that retail sales trends in Germany have been
volatile even though these series exclude auto sales which can be even
more volatile. The current month is turning trends sharply lower. April
is the second deeply negative month in a row. Weakness in March and
April offset what had looked like a strong gain in February sales. The
trends in Europe have been more consistently negative. Like in the US,
consumer readings in Germany and in Europe are generally among some of
the weakest in the entire economy. Weak retail sales keep this trend in
play.
| German Real and Nominal Retail Sales | ||||||||
|---|---|---|---|---|---|---|---|---|
| Nominal | Apr-08 | Mar-08 | Feb-08 | 3-MO | 6-MO | 12-MO | Yr Ago | QTR Saar |
| Retail Excl Auto | -1.3% | -2.2% | 1.4% | -8.1% | -0.8% | -3.1% | 1.7% | -13.1% |
| Food Beverage & Tobacco | -1.0% | -0.1% | 0.0% | -4.4% | -3.1% | -2.3% | 1.7% | -6.4% |
| Clothing footwear | 1.2% | -10.3% | 6.2% | -13.4% | -4.0% | -9.9% | 8.6% | -21.8% |
| Real | ||||||||
| Retail Excl auto | -1.7% | -2.2% | 1.0% | -11.3% | -3.9% | -5.6% | 0.9% | -15.9% |
by Robert Brusca May 30, 2008
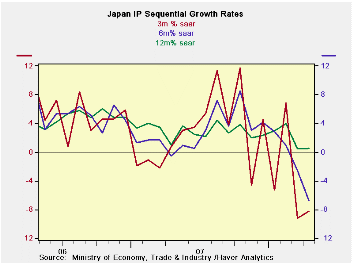
Industrial output is slowing sharply in Japan and across most sectors. Consumer goods and intermediate goods are leading the way down. Very sharp declines have come in textiles and transportation goods in the past two months. Intermediate goods, in addition to consumer goods, find weak trends in place over two months as well. Even investment goods that have been relatively stronger on a worldwide basis are showing some softness as the output of investment goods fell in March in Japan and managed only a weak rebound in April.
In the new quarter-to-date all sectors and breakdowns show steep declines except for mining. Japan like German is getting off to a weak start in 2008-Q2. For Germany it is weak retail sales, for Japan it’s weakness in output.
| Japan Industrial Production Trends | ||||||||
|---|---|---|---|---|---|---|---|---|
| m/m % | Saar % | Yr/Yr | Qtr-2-Date | |||||
| seasonally adjusted | Apr-08 | Mar-08 | Feb-08 | 3-mo | 6-mo | 12-mo | Yr-Ago | % AR |
| Mining & Manufacturing | -0.3% | -3.4% | 1.6% | -8.2% | -6.8% | 0.6% | 1.1% | -11.6% |
| Total Industry | -0.1% | -3.8% | 2.0% | -7.5% | -5.6% | 0.6% | 1.1% | -11.4% |
| Manufacturing | -0.4% | -3.3% | 1.6% | -8.2% | -6.8% | 0.6% | 1.0% | -11.7% |
| Textiles | -1.6% | -1.3% | -0.2% | -11.8% | -10.4% | -7.1% | -5.0% | -14.3% |
| Transportation | -2.2% | -5.6% | 1.3% | -23.6% | -11.0% | 4.2% | 0.7% | -29.0% |
| Product Group | ||||||||
| Consumer Goods | -1.3% | -5.2% | 2.7% | -14.7% | -9.0% | 0.1% | -1.9% | -21.4% |
| Intermediate Goods | -0.7% | -1.3% | 1.0% | -4.3% | -5.3% | 2.1% | 3.1% | -7.5% |
| Investment Goods | 0.5% | -4.3% | 1.1% | -10.8% | -7.2% | -2.5% | 0.2% | -11.9% |
| Mining | 4.2% | 1.4% | 2.3% | 36.4% | -1.3% | 0.6% | 5.9% | 41.3% |
| Electricity & Gas | 3.8% | -11.4% | 9.7% | 3.7% | 3.5% | -0.2% | 4.2% | -8.0% |

Tom Moeller
AuthorMore in Author Profile »Prior to joining Haver Analytics in 2000, Mr. Moeller worked as the Economist at Chancellor Capital Management from 1985 to 1999. There, he developed comprehensive economic forecasts and interpreted economic data for equity and fixed income portfolio managers. Also at Chancellor, Mr. Moeller worked as an equity analyst and was responsible for researching and rating companies in the economically sensitive automobile and housing industries for investment in Chancellor’s equity portfolio. Prior to joining Chancellor, Mr. Moeller was an Economist at Citibank from 1979 to 1984. He also analyzed pricing behavior in the metals industry for the Council on Wage and Price Stability in Washington, D.C. In 1999, Mr. Moeller received the award for most accurate forecast from the Forecasters' Club of New York. From 1990 to 1992 he was President of the New York Association for Business Economists. Mr. Moeller earned an M.B.A. in Finance from Fordham University, where he graduated in 1987. He holds a Bachelor of Arts in Economics from George Washington University.
More Economy in Brief


