 Global| Aug 29 2008
U.S. Income Fell Without the Stimulus Checks
by:Tom Moeller
|in:Economy in Brief
Summary
Nominal personal income fell 0.7% in July after gains of 0.1% and 1.8% during the prior two months. Those increases were lifted by $90B from the government's tax rebate checks. The June drop in personal income exceeded Consensus [...]
Nominal personal income fell 0.7% in July after gains of 0.1% and 1.8% during the prior two months. Those increases were lifted by $90B from the government's tax rebate checks. The June drop in personal income exceeded Consensus expectations for a 0.2% decline.
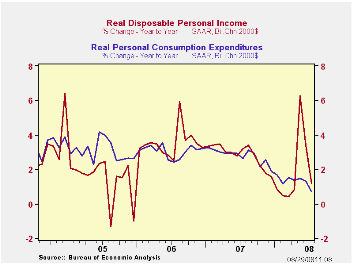
Disposable personal income fell 1.1% last month following a 1.9% decline during June and a 5.7% jump during May. Net taxes increased 1.8% last month, due to the absence of rebates, after an 18.7% June jump.
Wage & salary income increased a modest 0.3% (4.1% y/y) after a 0.2% rise during June. These increases left the annualized three-month growth in wages low at 3.2% versus a 5.6% increase during 2007 and a 6.3% 2006 gain. Factory sector wages ticked up 0.1% (1.1% y/y) and three-month growth totaled 2.1%. Wages & salaries in the private service-providing industries increased 0.2% (4.3% y/y) while three-month growth amounted to 2.6% after last year's gain of 6.4%. Wages in the government sector were firm again and rose 0.4% (5.5% y/y) rise and three-month growth rose to 5.8%.
Interest income jumped 1.1% (-1.7% y/y) and made up the prior
month's decline. Interest income rose 7.9% during all of 2007. Dividend
income rose 0.6% (8.2% y/y) for the third consecutive month. That
followed a 12.4% rise last year and a 21.7% gain during 2006.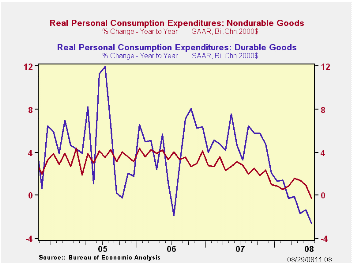
The PCE chain price index was strong again and rose 0.6%, firm due to higher energy prices. The gain in the core PCE price index also remained firm with a 0.3% increase. That matched Consensus forecasts but three-month growth increased to 2.8%, the firmest growth rate since early 2006. Durable goods prices ticked up 0.1% (-1.0% y/y) for the second month. Last month's small increase was held back by a 0.2% decline in furniture prices (-4.4% y/y). Prices for nondurable goods, however, were quite firm and they posted 1.2% gain (8.2% y/y). Apparel prices also were firm and they rose 0.1% y/y after the 2.2% rate of deflation reached this past March. Services prices jumped 0.4% (3.8% y/y) led higher by a 4.1% (15.2% y/y) jump in electricity costs.
Personal consumption expenditures ticked up 0.2% after the 0.6% rise during June. Adjusted for price inflation, however, real spending fell another 0.4% after a 0.1% downtick during June. Three-month growth in real spending amounted to a negative 0.7% (AR) with real spending on motor vehicles down at a 25.2% rate. Furniture spending rose at a 6.0% rate during the last three months but spending on clothing fell at a 5.2% rate.
The personal savings rate halved to 1.2% from 2.5% in June and 4.9% in May.
The figures noted above are available in the Haver USECON and in the USNA databases.
| Disposition of Personal Income (%) | July | June | Y/Y | 2007 | 2006 | 2005 |
|---|---|---|---|---|---|---|
| Personal Income | -0.7 | 0.1 | 4.2 | 6.1 | 7.1 | 5.6 |
| Disposable Personal Income | -1.1 | -1.9 | 5.8 | 5.5 | 6.4 | 4.4 |
| Personal Consumption | 0.2 | 0.6 | 5.3 | 5.5 | 5.9 | 6.2 |
| Saving Rate | 1.2 | 2.5 | 0.3 (July '07) | 0.5 | 0.7 | 0.3 |
| PCE Chain Price Index | 0.6 | 0.7 | 4.5 | 2.6 | 2.8 | 2.9 |
| Less food & energy | 0.3 | 0.3 | 2.4 | 2.2 | 2.3 | 2.1 |
by Tom Moeller August 29, 2008
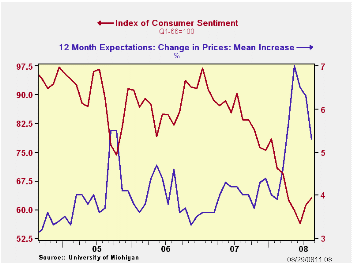
The University of Michigan's reading of consumer sentiment for this month rose 2.9% from July to an index level of 63.0. That was firmer than a 0.8% uptick reported in the mid-month survey. The gain followed a 8.5% increase in July and the level was higher than Consensus expectations for a reading of 62.0. The latest level of sentiment was the highest since March.
During the last ten years there has been a 47% correlation
between the level of sentiment and the three-month change in real
consumer spending.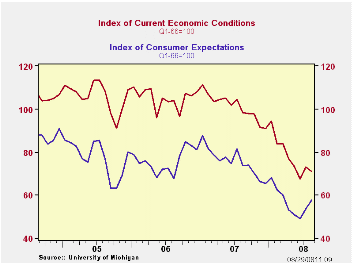
The expectations component of overall sentiment continued firm and rose 8.2% after the 8.7% increase during July. Expectations for business conditions during the next year jumped and expectations for conditions during the next five years rose firmly as well.The expected change in personal finances were unchanged after a strong July increase.
The current conditions index fell 2.9% for the month and reversed much of the improvement during July. The decline was due to a sharp decline in the index of whether now is a good time to buy large household goods. It reversed half of the July gain. The view of current personal finances also fell slightly.
The opinion of government policy, which apparently influences economic expectations, stabilized after a sharp decline in July. Only six percent of respondents thought that a good job was being done by government.
The mean expected rate of inflation during the next twelve months fell further to 5.3%. During the next five years, however, the expected inflation rate rose to 3.9% .
The University of Michigan survey is not seasonally adjusted.The reading is based on telephone interviews with about 500 households at month-end; the mid-month results are based on about 300 interviews. The summary indexes are in Haver's USECON database, with details in the proprietary UMSCA database.
| University of Michigan | August | August (Prelim.) | July | Aug. y/y | 2007 | 2006 | 2005 |
|---|---|---|---|---|---|---|---|
| Consumer Sentiment | 63.0 | 61.7 | 61.2 | -24.5% | 85.6 | 87.3 | 88.5 |
| Current Conditions | 71.0 | 69.3 | 73.1 | -27.8% | 101.2 | 105.1 | 105.9 |
| Expectations | 57.9 | 56.8 | 53.5 | -21.4% | 75.6 | 75.9 | 77.4 |
by Robert Brusca August 29, 2008
This Month - The European Commission’s monthly indices show
that the area continued to lose ground as economic sentiment slipped
from 88.8 in July to 86.9 in August. All main sector gauges fell in the
month save consumer confidence which advanced one thin point but
remained negative overall and weak in its historic range.
Assessing the levels of the various indicators - The EU
sentiment gauge stands in the 31st percentile of its range in August
2008. The gage for EMU is slightly stronger in its 35.8th percentile.
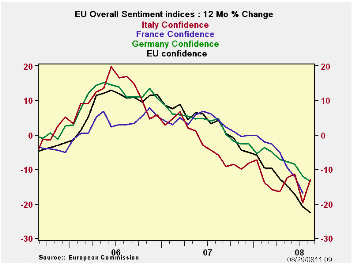
France did not report on time this month and that often seem to be the
case for France when things are deteriorating. Reporting later does not
make things better. Germany and Italy have overall sentiment gauges
that lie in about the 35th percentile of their respective historic
ranges. Spain is in the bottom 8 percentile of its range. The UK, an EU
member, drags down the average with a heavy weight as its gauge stands
in the bottom 19 percent of its historic range.
Assessing the sectors this month: In August the retail index
fell especially hard, dropping by 4 points. This compares to a three
point drop for the industrial sector. Services backtracked by only one
point, but that sector is the relative weakest in the 13th percentile
of its historic range. Retailing is in the 22nd percentile of its
historic range and consumer confidence with its one-point rise stands
in the 27th percentile of its range. Construction at a deeply negative
-18 is still in the 51st percentile of its historic range while MFG at
a -10 is at the 50th percentile the dead middle of its range.
EMU inflation, the EU Commission survey and more - There is a
lot of concern about inflation in EMU at the moment. The day also saw
the release of the EMU July HICP. That preliminary reading showed
inflation has notched down to 3.8% from 4% - a move in the right
direction but still distant from the 2% ECB ceiling for inflation. In
the EU Commission survey there was some evidence that inflation
expectations were adjusting in a positive direction. For industrial
selling prices, expectations fell by three months to a +17 level and
stand in the 75th percentile of their historic range- still high. For
consumers, expected price trends in the next 12-months broke sharply
lower dropping by 8 points on the month to stand at +22 in the 57th
percentile of their historic range. In construction prices expectations
stood at a +4 down in the month and down sharply from +111 in June but
still held in the 63rd percentile of their range. All in all actual
inflation did edge lower in the month of July and expectations are
moving in the right direction, lower, in August. The ECB can breathe
somewhat of a sigh of relief. The bad inflation news on the day came
form Germany where more first half wage agreements showed signs of
edging over 4%. So it was not a perfect day but it was a good day for
inflation-watchers.
| EU Sectors and Country level Overall Sentiment | |||||||||||
|---|---|---|---|---|---|---|---|---|---|---|---|
| EU | Aug 08 |
Jul 08 |
Jun 08 |
May 08 |
%tile | Rank | Max | Min | Range | Mean | R-SQ w/Overall |
| Overall | 86.9 | 88.8 | 94.5 | 97.1 | 31.8 | 230 | 116 | 73 | 43 | 101 | 1.00 |
| Industrial | -10 | -7 | -4 | -3 | 50.0 | 156 | 7 | -27 | 34 | -6 | 0.86 |
| Consumer Confidence | -19 | -20 | -17 | -14 | 27.6 | 225 | 2 | -27 | 29 | -10 | 0.83 |
| Retail | -15 | -11 | -5 | -3 | 22.2 | 239 | 6 | -21 | 27 | -5 | 0.49 |
| Construction | -18 | -17 | -14 | -11 | 51.1 | 157 | 5 | -42 | 47 | -15 | 0.42 |
| Services | -1 | 0 | 7 | 6 | 13.2 | 130 | 32 | -6 | 38 | 17 | 0.80 |
| % m/m | Aug 08 |
Based on Level | Level | ||||||||
| EMU | -0.8% | -5.6% | -2.9% | 88.8 | 35.8 | 226 | 117 | 73 | 44 | 101 | 0.93 |
| Germany | -2.7% | -4.1% | -1.5% | 94.7 | 37.9 | 182 | 121 | 79 | 42 | 101 | 0.64 |
| France | N/A | -4.6% | -3.0% | N/A | N/A | N/A | N/A | N/A | N/A | N/A | N/A |
| Italy | 4.8% | -10.1% | -0.1% | 89.5 | 35.7 | 224 | 122 | 71 | 51 | 101 | 0.80 |
| Spain | -4.3% | 1.6% | -7.8% | 71.0 | 8.4 | 243 | 118 | 67 | 51 | 100 | 0.60 |
| Memo:UK | -6.1% | -7.8% | 2.3% | 80.3 | 19.0 | 235 | 130 | 69 | 61 | 101 | 0.42 |
| Since 1990 except Services (Oct 1996) 247 | -Count | Services: | 142 | -Count | |||||||
| Sentiment is an index, sector readings are net balance diffusion measures | |||||||||||

Tom Moeller
AuthorMore in Author Profile »Prior to joining Haver Analytics in 2000, Mr. Moeller worked as the Economist at Chancellor Capital Management from 1985 to 1999. There, he developed comprehensive economic forecasts and interpreted economic data for equity and fixed income portfolio managers. Also at Chancellor, Mr. Moeller worked as an equity analyst and was responsible for researching and rating companies in the economically sensitive automobile and housing industries for investment in Chancellor’s equity portfolio. Prior to joining Chancellor, Mr. Moeller was an Economist at Citibank from 1979 to 1984. He also analyzed pricing behavior in the metals industry for the Council on Wage and Price Stability in Washington, D.C. In 1999, Mr. Moeller received the award for most accurate forecast from the Forecasters' Club of New York. From 1990 to 1992 he was President of the New York Association for Business Economists. Mr. Moeller earned an M.B.A. in Finance from Fordham University, where he graduated in 1987. He holds a Bachelor of Arts in Economics from George Washington University.
More Economy in Brief


