 Global| Oct 10 2008
U.S. Import Prices Overall Fell Further With Lower Oil Prices
by:Tom Moeller
|in:Economy in Brief
Summary
Total U.S. import prices fell slid 3.7% last month after the revised August decline of 2.6%. The September skid contrasted with expectations for a 2.5% drop. Petroleum prices fell about as they did in August, by 9.0%. So far this [...]
Total U.S. import prices fell slid 3.7% last month after the revised August decline of 2.6%. The September skid contrasted with expectations for a 2.5% drop.
Petroleum prices fell about as they did in August, by 9.0%. So far this month imported crude petroleum prices are down another 15% m/m.
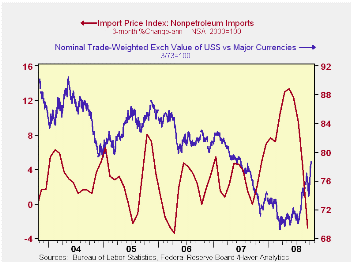
Less petroleum, import prices fell 0.9% after a downwardly revised 0.5% drop during August. During the last three months prices fell at a 2.8% annual rate versus the 12-to-13% rates of positive growth this past spring.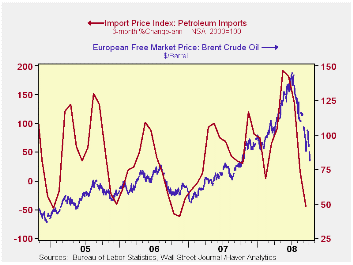
Growth in import prices will slow further given the recent rise in the foreign exchange value of the dollar. During the last ten years there has been a 66% (negative) correlation between the nominal trade-weighted exchange value of the US dollar vs. major currencies and the y/y change in non oil import prices. The correlation is a reduced 47% against a broader basket of currencies.
Capital goods import prices fell 0.1% for the second consecutive month. On a three-month basis prices rose at a 0.4% annual rate after a 5% rate of increase earlier this year. Less the lower prices of computers, capital goods prices rose 0.2% as they did in August. Three month growth of 4.4% was half its peak earlier this year. Prices of computers, peripherals & accessories fell 1.1% (-7.5% y/y) last month, about as they did during the prior three months.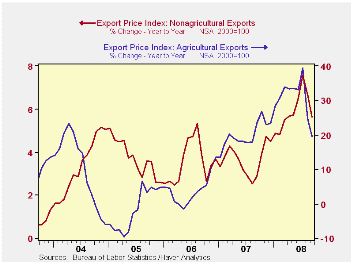
Finally, prices for nonauto consumer goods fell 0.1% and the 0.8% rate of increase during the last three months is down from the 5.9% peak earlier this year. Durable goods prices overall rose at a 1.2% rate during the last three months versus a 6.2% rate of increase earlier this year.
Total export prices fell another 1.0% due to a 0.3% (+19.5% y/y) dip in agricultural prices which followed a 9.6% August skid. Nonagricultural export prices fell hard again, last month by 0.7% (+5.6% y/y).
| Import/Export Prices (NSA, %) | September | August | Y/Y | 2007 | 2006 | 2005 |
|---|---|---|---|---|---|---|
| Import - All Commodities | -3.0 | -2.6 | 14.5 | 4.2 | 4.9 | 7.5 |
| Petroleum | -9.0 | -8.2 | 47.1 | 11.6 | 20.6 | 37.6 |
| Non-petroleum | -0.9 | -0.5 | 6.5 | 2.7 | 1.7 | 2.7 |
| Export- All Commodities | -1.0 | -1.7 | 6.8 | 4.9 | 3.6 | 3.2 |

Tom Moeller
AuthorMore in Author Profile »Prior to joining Haver Analytics in 2000, Mr. Moeller worked as the Economist at Chancellor Capital Management from 1985 to 1999. There, he developed comprehensive economic forecasts and interpreted economic data for equity and fixed income portfolio managers. Also at Chancellor, Mr. Moeller worked as an equity analyst and was responsible for researching and rating companies in the economically sensitive automobile and housing industries for investment in Chancellor’s equity portfolio. Prior to joining Chancellor, Mr. Moeller was an Economist at Citibank from 1979 to 1984. He also analyzed pricing behavior in the metals industry for the Council on Wage and Price Stability in Washington, D.C. In 1999, Mr. Moeller received the award for most accurate forecast from the Forecasters' Club of New York. From 1990 to 1992 he was President of the New York Association for Business Economists. Mr. Moeller earned an M.B.A. in Finance from Fordham University, where he graduated in 1987. He holds a Bachelor of Arts in Economics from George Washington University.
More Economy in Brief


