 Global| Dec 16 2010
U.S. Housing Starts Tick Up But Trend Still Flat
by:Tom Moeller
|in:Economy in Brief
Summary
Activity in the housing sector has stabilized at a low level. That's the continuing message from the Commerce Department's housing starts data. Starts rose 3.9% last month to 555,000 (AR) units from 534,000 during October, initially [...]
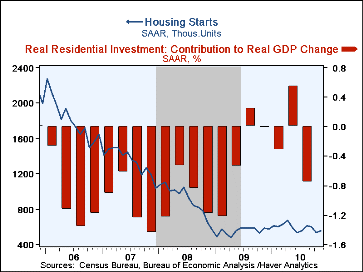
Activity in the housing sector has stabilized at a low level. That's the continuing message from the Commerce Department's housing starts data. Starts rose 3.9% last month to 555,000 (AR) units from 534,000 during October, initially reported as 519,000. Having reversed a modest up turn this Spring, starts remained just above the low of the last recession; down more than three-quarters from the peak in early-2006. The latest figure beat Consensus expectations for 550,000 starts.
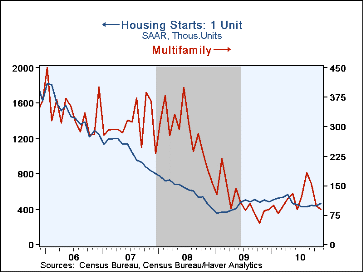
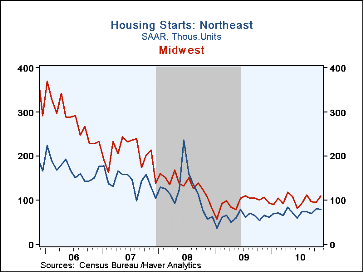
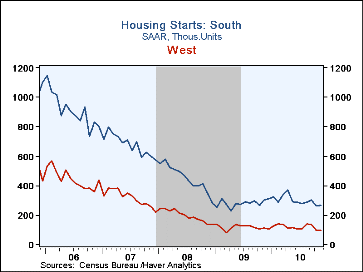
The November upturn reflected a 6.9% increase in starts of single-family homes to 465,000 from a downwardly revised October level. Starts of multi-unit units fell 9.1% to 90,000 from an upwardly revised October. Starts of 2-to-4 unit structures, which are few in number, rose by two-thirds m/m and have doubled y/y. Starts with more than five units fell 18.2% to the lowest since February (-5.3% y/y). Starts in the Midwest were strongest last month posting a 15.8% rebound from October while starts elsewhere either rose or fell modestly.
Working the other way, building permits fell 4.0% during November to near the recession low. Permits for single-family units were firmer, up 3.0% m/m and by nearly one-quarter from the recession low, but multi-family permits conversely fell nearly one-quarter to just above the low.
The housing starts figures can be found in Haver's USECON database.
Mortgage-Backed Securities: How Important Is "Skin in the Game"? from the Federal Reserve Bank of San Francisco can be found here.
| Housing Starts (000s,SAAR) | Nov. | Oct. | Sept. | Nov Y/Y | 2009 | 2008 | 2007 |
|---|---|---|---|---|---|---|---|
| Total | 555 | 534 | 601 | -5.8% | 554 | 900 | 1,342 |
| Single-Family | 465 | 435 | 447 | -7.7 | 442 | 616 | 1,036 |
| Multi-Family | 90 | 99 | 154 | 5.9 | 112 | 284 | 306 |
| Starts By Region | |||||||
| Northeast | 79 | 81 | 69 | 19.7 | 61 | 120 | 143 |
| Midwest | 110 | 95 | 97 | 2.8 | 95 | 134 | 206 |
| South | 269 | 263 | 301 | -11.2 | 281 | 451 | 676 |
| West | 97 | 95 | 134 | -14.2 | 117 | 195 | 317 |
| Building Permits | 530 | 552 | 547 | -14.7 | 583 | 896 | 1,392 |
Tom Moeller
AuthorMore in Author Profile »Prior to joining Haver Analytics in 2000, Mr. Moeller worked as the Economist at Chancellor Capital Management from 1985 to 1999. There, he developed comprehensive economic forecasts and interpreted economic data for equity and fixed income portfolio managers. Also at Chancellor, Mr. Moeller worked as an equity analyst and was responsible for researching and rating companies in the economically sensitive automobile and housing industries for investment in Chancellor’s equity portfolio. Prior to joining Chancellor, Mr. Moeller was an Economist at Citibank from 1979 to 1984. He also analyzed pricing behavior in the metals industry for the Council on Wage and Price Stability in Washington, D.C. In 1999, Mr. Moeller received the award for most accurate forecast from the Forecasters' Club of New York. From 1990 to 1992 he was President of the New York Association for Business Economists. Mr. Moeller earned an M.B.A. in Finance from Fordham University, where he graduated in 1987. He holds a Bachelor of Arts in Economics from George Washington University.


