 Global| Jul 17 2008
U.S. Housing Starts Rebound All Multi-Family
by:Tom Moeller
|in:Economy in Brief
Summary
Housing starts rebounded smartly last month. The 9.1% m/m rise to 1.066M units by far exceeded Consensus expectations for .960M starts. The rise was, however, due solely to the multi-family sector. Multi-family starts surged 42.1% [...]
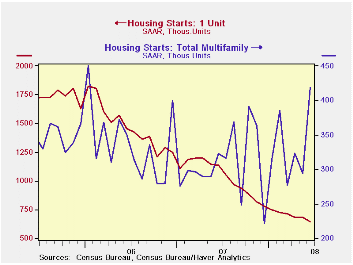
Housing starts rebounded smartly last month. The 9.1% m/m rise to 1.066M units by far exceeded Consensus expectations for .960M starts. The rise was, however, due solely to the multi-family sector.
Multi-family starts surged 42.1% last month to the highest
level since January of 2006. In part, the rise was making up for sharp
declines during two of the prior three months. By region, the pop in
multi-family units was all in the Northeast. Elsewhere, they fell. 
Single-family starts continued to slide. They fell 5.3% to 647,000 from a May level which was revised up slightly. The latest level was the lowest since January 1991. For 2Q as a whole, single family starts fell 7.9% from 1Q after that quarter's 11.9% decline.
Single-family housing starts in the Northeast reversed all of a May increase with a 9.2% (-44.9% y/y) decline. Starts in the West also continued lower with a 5.8% drop to the lowest level since January. In the Midwest, starts held at the lows of the year and fell 5.3% (-45.7% y/y) after an 8.7% May gain. Finally, single-family starts in the South reversed the May increase and fell 4.4% (-36.9% y/y), but they were at a new low for this cycle and the lowest since 1991.
Building permits recovered 11.6% but, here again, the rise was due solely to a 39.4% rise in multi-family. Permits to build single-family units fell 3.5% to the lowest level since 1991.
| Housing Starts (000s, AR) | June | May | Y/Y | 2007 | 2006 | 2005 |
|---|---|---|---|---|---|---|
| Total | 1,066 | 977 | -26.9% | 1,344 | 1,812 | 2,073 |
| Single-Family | 647 | 683 | -43.0% | 1,039 | 1,474 | 1,719 |
| Multi-Family | 419 | 294 | 30.1% | 304 | 338 | 354 |
| Building Permits | 1,091 | 978 | -23.9% | 1,371 | 1,842 | 2,159 |
by Tom Moeller July 17, 2008
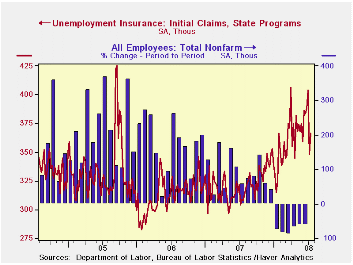
Initial claims for unemployment insurance rose a moderate 5.4% last week to 366,000 from a little revised level during the week prior. The increase fell short of Consensus expectations for a larger rise to 380,000 claims.
The latest figure is for the survey week for July nonfarm
payrolls. Jobless claims were down 18,000 (4.7%) from the June survey
period.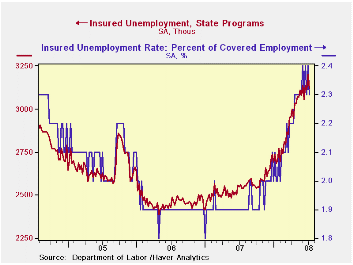
A claims level below 400,000 typically has been associated with growth in nonfarm payrolls. During the last ten years there has been a (negative) 76% correlation between the level of initial claims and the m/m change in nonfarm payroll employment. Over the longer period of time, the level of claims for jobless insurance has not trended higher with the size of the labor force due to a higher proportion of self-employed workers who are not eligible for benefits.
As a result of the latest weekly decline in initial claims, the four-week moving average fell to 376,500 (+20.5% y/y). During June claims averaged 391,000.
Continuing claims for unemployment insurance during the latest week fell by 81,000 and reversed about all of the prior week's rise. The decline, nevertheless, left the four-week average of continuing claims still rising. It increased 16,500 to another cycle high of 3,142,750 which was roughly a quarter higher than a year ago and the highest level since early 2004.
Continuing claims provide some indication of workers' ability to find employment and they lag the initial claims figures by one week.
The insured rate of unemployment fell back to 2.3%.
| Unemployment Insurance (000s) | 07/12/08 | 07/05/08 | Y/Y | 2007 | 2006 | 2005 |
|---|---|---|---|---|---|---|
| Initial Claims | 366 | 346 | 18.4% | 322 | 313 | 331 |
| Continuing Claims | -- | 3,122 | 21.9% | 2,552 | 2,459 | 2,662 |
by Tom Moeller July 17, 2008
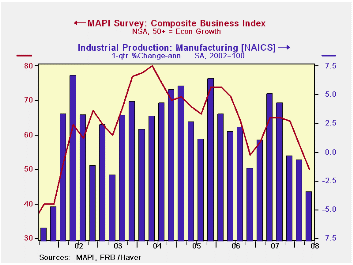
The 2Q '08 Composite Business Index published by the Manufacturers' Alliance/MAPI fell to 47 from a revised level of 58 in 1Q '08. Prior years' readings were revised and the latest was the lowest since 1Q '02.
During the last ten years there has been a 69% correlation
between the Composite Index Level and quarterly growth in US factory
sector output.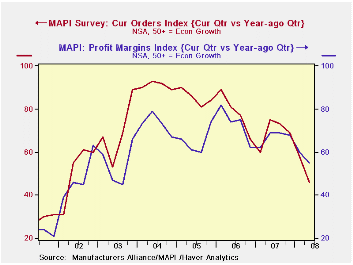
The current orders index fell sharply to the lowest level since 2002. The 1Q export orders index, however, remained relatively strong and ticked up slightly from 1Q, near its averages of the last four years. During the last ten years there has been a 59% correlation between the export orders index and quarterly growth in real US exports.
The profit margins index fell to its lowest level since 3Q '03 though capital spending intentions for the coming year remained relatively firm, down just moderately from the averages of the last four years. During the last ten years there has been a 75% correlation between the capital spending index and q/q growth in business investment.
The survey of 60 senior financial executives representing a broad range of manufacturing industries reflects the views on current & future business conditions. The business outlook index is a weighted sum of shipments, backlogs, inventories, and profit margin indexes.
For the latest US Business Outlook from the MAPI click here.
| Manufacturers' Alliance/MAPI Survey | 2Q '08 | 1Q '08 | 2Q '07 | 2007 | 2006 | 2005 |
|---|---|---|---|---|---|---|
| Composite Business Index | 46 | 58 | 75 | 69 | 78 | 85 |
by Robert Brusca July 17, 2008
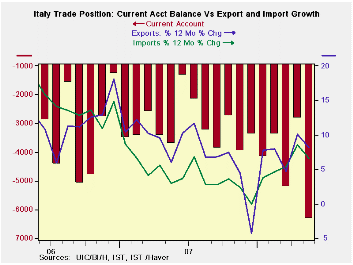
Italy’s goods trade deficit emerged in May after April posted
a surplus. The current deficit widened. Imports are now faltering with
capital goods and transport categories showing outright declines Yr/Yr
as domestic weakness takes its toll. But weak exports will shrink the
trade deficit and it is instead expanding. That is because exports for
now are falling faster than imports. Total exports fell at a 23% annual
rate over three months and are up by just 2.6% yr/yr. Europe is slowing
down and now Italy is facing such weak demand for its goods due to a
strong euro and weakening growth abroad that its domestic weakness is
being overwhelmed by weakness from these other sources.
| Italy's Trade Trends | |||||||
|---|---|---|---|---|---|---|---|
| m/mo % monthly rate | Period Specified saar | ||||||
| May-08 | Apr-08 | Mar-08 | 3-MO | 6-Mo | 12-Mo | Yr-Ago | |
| Current Account Bal | €€ (6,325) | €€ (2,816) | €€ (5,203) | €€ (4,781) | €€ (4,209) | €€ (3,548) | €€ (3,290) |
| Goods Balance | €€ (237) | €€ 692 | €€ 46 | €€ 167 | €€ 251 | €€ 355 | €€ (339) |
| Exports | -5.1% | 12.4% | -12.4% | -23.5% | 0.2% | 2.6% | 6.4% |
| Imports | -2.3% | 10.2% | -7.1% | -0.1% | 5.2% | 3.4% | 2.9% |
| Services Balance | €€ (953) | €€ (43) | €€ (497) | €€ (498) | €€ (378) | €€ (528) | €€ (450) |
| Exports | -6.4% | 11.8% | -5.3% | -3.7% | -7.8% | -0.6% | 2.5% |
| Imports | 6.5% | 4.3% | -7.6% | 10.6% | 5.8% | 4.5% | 7.7% |
| Not Seasonally Adjusted All Yr/Yr | |||||||
| Exports | May-08 | May-07 | May-06 | May-05 | |||
| Food & Beverages | 13.6% | -1.0% | 10.3% | 8.5% | |||
| Capital Goods | 6.2% | 3.6% | 21.0% | 4.4% | |||
| Transport | 8.9% | -1.3% | 34.2% | -1.9% | |||
| Consumer Goods | 3.7% | 0.9% | 7.6% | 8.3% | |||
| Other Goods | 3.7% | 17.0% | 5.1% | 19.6% | |||
| Imports | May-08 | May-07 | May-06 | May-05 | |||
| Food & Beverages | 11.2% | -2.0% | 8.9% | 3.2% | |||
| Capital Goods | -6.9% | 4.7% | 19.1% | 1.1% | |||
| Transport | -11.8% | 7.3% | 25.7% | -0.7% | |||
| Consumer Goods | 3.4% | -0.5% | 12.8% | 5.5% | |||
| Other Goods | 17.6% | -1.0% | 29.6% | 27.7% | |||
| Balances in Mlns of euros | |||||||

Tom Moeller
AuthorMore in Author Profile »Prior to joining Haver Analytics in 2000, Mr. Moeller worked as the Economist at Chancellor Capital Management from 1985 to 1999. There, he developed comprehensive economic forecasts and interpreted economic data for equity and fixed income portfolio managers. Also at Chancellor, Mr. Moeller worked as an equity analyst and was responsible for researching and rating companies in the economically sensitive automobile and housing industries for investment in Chancellor’s equity portfolio. Prior to joining Chancellor, Mr. Moeller was an Economist at Citibank from 1979 to 1984. He also analyzed pricing behavior in the metals industry for the Council on Wage and Price Stability in Washington, D.C. In 1999, Mr. Moeller received the award for most accurate forecast from the Forecasters' Club of New York. From 1990 to 1992 he was President of the New York Association for Business Economists. Mr. Moeller earned an M.B.A. in Finance from Fordham University, where he graduated in 1987. He holds a Bachelor of Arts in Economics from George Washington University.
More Economy in Brief


