 Global| Jan 17 2008
U.S. Housing Starts Plumb 1991 Lows
by:Tom Moeller
|in:Economy in Brief
Summary
Not since the recession of the early 1990s have housing starts fallen so low. A 14.2% m/m decline in December dropped starts to 1.006 million units after a downwardly revised 7.9% November decline. The decline, which by far exceeded [...]
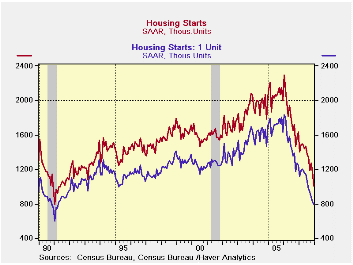
Not since the recession of the early 1990s have housing starts fallen so low. A 14.2% m/m decline in December dropped starts to 1.006 million units after a downwardly revised 7.9% November decline. The decline, which by far exceeded Consensus expectations for 1.145M starts, was to the lowest level since 1991.
For all of 2007 housing starts fell 25.8% after a 12.6% decline during 2006.
The relatively mild 2.9% m/m drop to .794M single family starts in December was hardly indicative of a less dramatic decline this cycle. It too dropped starts to the lowest level since early 1991. The decline followed drops in each month since March. Since the peak in early 2006, starts of single family homes are down 56.8%.
Multi-family starts plunged 40.3% last month after a 10.1% November decline. That left starts at their lowest level since 1994.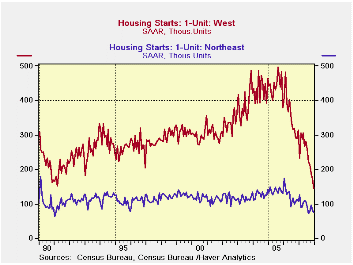
By region, single family starts in the Northeast continued down and fell 7.4% (-29.9% y/y) after a 16.5% November decline. Starts in the Northeast are 56.9% below the early 2006 peak. Single family starts in the Midwest fell 9.3% m/m (-29.4% y/y). These starts are down 65.3% from the early 2005 peak. Single family starts in the West nearly doubled the November rate of decline and fell 16.3% (-54.1% y/y). They are 71.0% below the 2005 high. And in the South, single family starts actually posted the second consecutive monthly gain (-30.0% y/y) but still closed the year 51.3% below peak.
Building permits fell 8.1% (-34.4% y/y) and were down 51.8% from the 2005 peak. Single-family permits posted a 10.1% m/m decline (-41.4% y/y), down 61.5% from the peak.
Today's Congressional testimony by Fed Chairman Ben S. Bernanke, The Economic Outlook, can be found here.
Measuring Consensus as the Midpoint of Central Tendency from the Federal Reserve Bank of St. Louis can be found here.
| Housing Starts (000s, AR) | December | November | Y/Y | 2007 | 2006 | 2005 |
|---|---|---|---|---|---|---|
| Total | 1,006 | 1,173 | -38.2% | 1,344 | 1,812 | 2,073 |
| Single-Family | 794 | 818 | -35.7% | 1,040 | 1,474 | 1,719 |
| Multi-Family | 212 | 355 | -45.4% | 304 | 338 | 354 |
| Building Permits | 1,068 | 1,162 | -34.4% | 1,370 | 1,842 | 2,159 |

Tom Moeller
AuthorMore in Author Profile »Prior to joining Haver Analytics in 2000, Mr. Moeller worked as the Economist at Chancellor Capital Management from 1985 to 1999. There, he developed comprehensive economic forecasts and interpreted economic data for equity and fixed income portfolio managers. Also at Chancellor, Mr. Moeller worked as an equity analyst and was responsible for researching and rating companies in the economically sensitive automobile and housing industries for investment in Chancellor’s equity portfolio. Prior to joining Chancellor, Mr. Moeller was an Economist at Citibank from 1979 to 1984. He also analyzed pricing behavior in the metals industry for the Council on Wage and Price Stability in Washington, D.C. In 1999, Mr. Moeller received the award for most accurate forecast from the Forecasters' Club of New York. From 1990 to 1992 he was President of the New York Association for Business Economists. Mr. Moeller earned an M.B.A. in Finance from Fordham University, where he graduated in 1987. He holds a Bachelor of Arts in Economics from George Washington University.
More Economy in Brief


