 Global| Jan 17 2008
U.S. Housing Starts Plumb 1991 Lows
by:Tom Moeller
|in:Economy in Brief
Summary
Not since the recession of the early 1990s have housing starts fallen so low. A 14.2% m/m decline in December dropped starts to 1.006 million units after a downwardly revised 7.9% November decline. The decline, which by far exceeded [...]
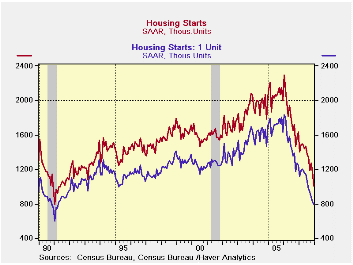
Not since the recession of the early 1990s have housing starts fallen so low. A 14.2% m/m decline in December dropped starts to 1.006 million units after a downwardly revised 7.9% November decline. The decline, which by far exceeded Consensus expectations for 1.145M starts, was to the lowest level since 1991.
For all of 2007 housing starts fell 25.8% after a 12.6% decline during 2006.
The relatively mild 2.9% m/m drop to .794M single family starts in December was hardly indicative of a less dramatic decline this cycle. It too dropped starts to the lowest level since early 1991. The decline followed drops in each month since March. Since the peak in early 2006, starts of single family homes are down 56.8%.
Multi-family starts plunged 40.3% last month after a 10.1%
November decline. That left starts at their lowest level since 1994.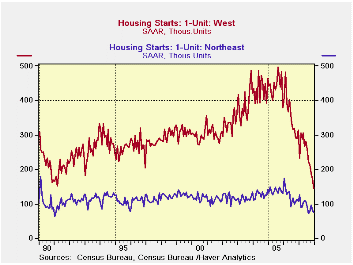
By region, single family starts in the Northeast continued down and fell 7.4% (-29.9% y/y) after a 16.5% November decline. Starts in the Northeast are 56.9% below the early 2006 peak. Single family starts in the Midwest fell 9.3% m/m (-29.4% y/y). These starts are down 65.3% from the early 2005 peak. Single family starts in the West nearly doubled the November rate of decline and fell 16.3% (-54.1% y/y). They are 71.0% below the 2005 high. And in the South, single family starts actually posted the second consecutive monthly gain (-30.0% y/y) but still closed the year 51.3% below peak.
Building permits fell 8.1% (-34.4% y/y) and were down 51.8% from the 2005 peak. Single-family permits posted a 10.1% m/m decline (-41.4% y/y), down 61.5% from the peak.
Today's Congressional testimony by Fed Chairman Ben S. Bernanke, The Economic Outlook, can be found here.
Measuring Consensus as the Midpoint of Central Tendency from the Federal Reserve Bank of St. Louis can be found here.
| Housing Starts (000s, AR) | December | November | Y/Y | 2007 | 2006 | 2005 |
|---|---|---|---|---|---|---|
| Total | 1,006 | 1,173 | -38.2% | 1,344 | 1,812 | 2,073 |
| Single-Family | 794 | 818 | -35.7% | 1,040 | 1,474 | 1,719 |
| Multi-Family | 212 | 355 | -45.4% | 304 | 338 | 354 |
| Building Permits | 1,068 | 1,162 | -34.4% | 1,370 | 1,842 | 2,159 |
by Tom Moeller January 17, 2008
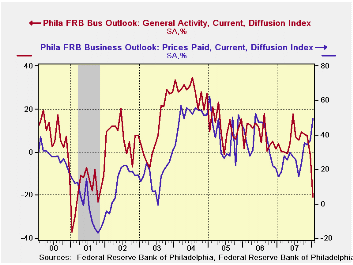
The Philadelphia Federal Reserve Bank reported that it's Index of General Business Conditions in the manufacturing sector cratered to -20.9 this month from what was a revised level of -1.6 in December. The latest level was the lowest since the recession year 2001.
The index is a diffusion index for each component or series. It reflects the increase in activity reported less the decrease.
During the last ten years there has been a 59% correlation
between the level of the Philadelphia Fed Business Conditions Index and
the three-month growth in factory sector industrial production. There
has been a 42% correlation with q/q growth in real GDP.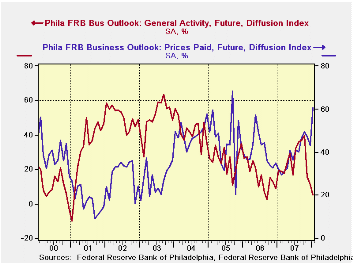
The decline represented broad based moves by each of the sub indexes into negative territory. New orders and inventories were notably weak while shipments, unfilled orders and vendor deliveries all were down. The employment index also fell. During the last ten years there has been a 75% correlation between the employment index and the three-month growth in factory payrolls.
The business conditions index reflects a separate survey question, not the sub indexes.
The prices paid index also was strong, rising to the highest level since mid-2006. During the last ten years there has been a 76% correlation between the prices paid index and the three-month growth in the intermediate goods PPI. There has been an 85% correlation with the change in core intermediate goods prices.
The separate index of expected business conditions in six months fell sharply to the latest was the lowest reading since mid-2006. Expectations for new orders were notably weak but expectations for the number of employees rose for the second month.
| January | December | Jan. '07 | 2007 | 2006 | 2005 | |
|---|---|---|---|---|---|---|
| General Activity Index | -20.9 | -1.6 | 3.6 | 5.1 | 8.1 | 11.5 |
| Prices Paid Index | 49.8 | 36.5 | 15.6 | 26.4 | 36.6 | 40.1 |
by Tom Moeller January 17 2008
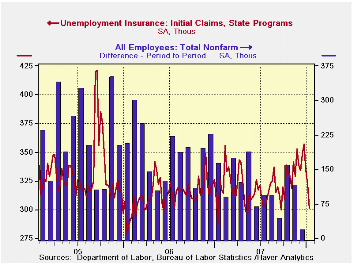
Unexpectedly, initial claims for jobless insurance dropped 21,000 last week to 301,000 after an unrevised 12,000 decline during the week prior. The latest level was the lowest since late September and contrasted with expectations for a rise to 332,000 claims. The recent claims figures may still be distorted by seasonal adjustment difficulties this time of year.
The latest claims figure covers the survey week for January nonfarm payrolls and claims fell 47,000 (-13.5%) from the December period.
The four week moving average of initial claims, a measure
which smoothes out most of the series' w/w volatility, fell to 328,500
(+5.6% y/y).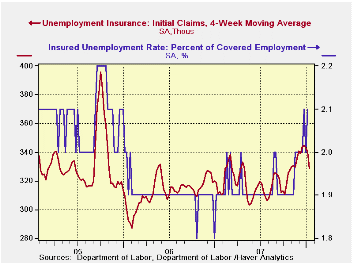
A claims level below 400,000 typically has been associated with growth in nonfarm payrolls. During the last six years there has been a (negative) 78% correlation between the level of initial claims and the m/m change in nonfarm payroll employment.
Continuing claims for unemployment insurance rose 66,000 and reversed a revised 69,000 drop during the prior week. The figure provides some indication of workers' ability to find employment.
The continuing claims numbers lag the initial claims figures by one week.
The insured rate of unemployment rose back to the cycle's high of 2.1%.
The Fed's latest Beige Book covering regional economic conditions can be found here.
| Unemployment Insurance (000s) | 01/12/08 | 01/05/07 | Y/Y | 2006 | 2005 | 2004 |
|---|---|---|---|---|---|---|
| Initial Claims | 301 | 322 | 4.9% | 313 | 331 | 343 |
| Continuing Claims | -- | 2,751 | 11.3% | 2,459 | 2,662 | 2,924 |
by Robert Brusca January 17 2008
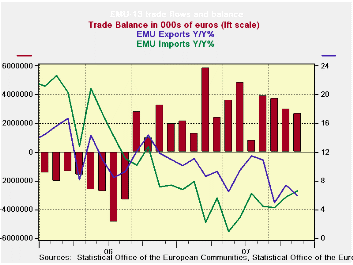
Yr/Yr EMU import growth is now exceeding export growth. Import
growth is creeping up at a faster pace while export growth is being
damped and is faltering. But sequential growth rates within the past
year shows that most components within the import aggregate are seeing
growth tail off with the exception of food. For exports sequential
growth rates also indicates a slowing. The sequential growth rate
parses the data over the past year to allow us to get a sense of the
intra-yearly pattern. What we see there makes us wonder about demand
within the Euro Area since imports are slowing within that horizon.
Since Euro Area exports are slowing on that horizon as well we are left
to wonder if export markets for EMU are also slowing or if it is an
impact of the strong euro value or of both.
Global growth
As we begin to get evidence of Europe’s slowing we are also getting re-thinks on the growth rates for member countries. The Bank of France’s survey is pointing to a softer rate of growth in Q4. Germany is said to be considering a reduction in its new forecast as some private outlooks have been cut. The EU Commission is now reported to be in the process of revamping its outlook to find Europe less insulated from the effect of a US slowdown. Japan has been slowing and the government has been reluctant to downgrade growth, as has the BOJ. China is suffering though some overheating and despite it’s trying to forestall any slowing until after the Olympic games, it has been forced into a more defensive monetary policy sooner than it desired.
On balance there is a considerable amount of evidence to support the notion of slowing growth on a widespread global scale. Commodity prices are just beginning to reflect this shift. But so far we have no indication how much the slowdown might progress. Some hold out hope that demand will remain in place in the developing world and will buffer the growth in the main industrial countries. There is little evidence of that or that such a small amount of essentially infrastructure spending that might be resilient might support global growth. Instead, the evidence seems to be falling on the side of showing that the US slowdown drags the world with it and that it is happening again.
| Ezone 13-Trade trends for goods | ||||||
|---|---|---|---|---|---|---|
| m/m% | % Saar | |||||
| Nov-07 | Oct-07 | 3-Mo | 6-Mo | 12-Mo | 12-Mo Ago | |
| Balance* | €€ 2,718 | €€ 2,984 | €€ 3,141 | €€ 3,160 | €€ 3,024 | €€ (1,251) |
| Exports | ||||||
| All Exports | 0.3% | 1.2% | 0.5% | 9.9% | 5.9% | 11.9% |
| Food and Drinks | -0.7% | 1.6% | -3.4% | 13.7% | 8.3% | 11.5% |
| Raw materials | -1.3% | 1.0% | 2.6% | -0.6% | 0.9% | 22.4% |
| Other | 0.4% | 1.2% | 0.7% | 10.0% | 5.9% | 11.7% |
| Manufacturing | -0.7% | 0.3% | -8.1% | 8.2% | 1.9% | 15.4% |
| Imports | ||||||
| All Imports | 0.5% | 1.9% | 4.4% | 11.8% | 6.6% | 7.2% |
| Food and Drinks | -3.4% | -1.2% | 23.7% | 26.0% | 14.7% | 5.4% |
| Raw materials | -3.9% | 1.1% | -24.3% | -5.7% | -3.7% | 27.7% |
| Other | 1.0% | 2.1% | 5.0% | 12.0% | 6.7% | 6.4% |
| Manufacturing | -2.4% | -0.9% | -19.2% | 1.1% | -0.2% | 10.6% |
| *Eur mlns; mo or period average | ||||||

Tom Moeller
AuthorMore in Author Profile »Prior to joining Haver Analytics in 2000, Mr. Moeller worked as the Economist at Chancellor Capital Management from 1985 to 1999. There, he developed comprehensive economic forecasts and interpreted economic data for equity and fixed income portfolio managers. Also at Chancellor, Mr. Moeller worked as an equity analyst and was responsible for researching and rating companies in the economically sensitive automobile and housing industries for investment in Chancellor’s equity portfolio. Prior to joining Chancellor, Mr. Moeller was an Economist at Citibank from 1979 to 1984. He also analyzed pricing behavior in the metals industry for the Council on Wage and Price Stability in Washington, D.C. In 1999, Mr. Moeller received the award for most accurate forecast from the Forecasters' Club of New York. From 1990 to 1992 he was President of the New York Association for Business Economists. Mr. Moeller earned an M.B.A. in Finance from Fordham University, where he graduated in 1987. He holds a Bachelor of Arts in Economics from George Washington University.
More Economy in Brief


