 Global| Dec 16 2009
U.S. Housing Starts Improve Modestly
by:Tom Moeller
|in:Economy in Brief
Summary
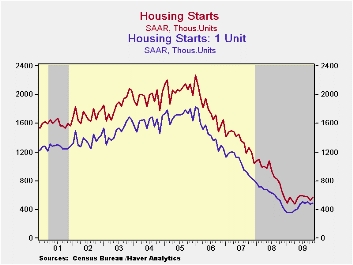
The recent recovery in home building has been hardly ebullient. Housing starts rose 8.9% last month to 574,000 (AR) units versus 527,000 during October, which was revised down slightly. These levels were, however, 6.2% below the 3Q [...]
 The recent
recovery in home building has been hardly ebullient. Housing starts
rose 8.9% last month to 574,000 (AR) units versus 527,000 during
October, which was revised down slightly. These levels were, however,
6.2% below the 3Q average and remain down 12.4% y/y. More sobering is
the startling decline in housing in recent years. Since the peak in
January of 2006, starts have fallen by more than three-quarters.
November's figure fell short of Consensus expectations for 578,000
starts.
The recent
recovery in home building has been hardly ebullient. Housing starts
rose 8.9% last month to 574,000 (AR) units versus 527,000 during
October, which was revised down slightly. These levels were, however,
6.2% below the 3Q average and remain down 12.4% y/y. More sobering is
the startling decline in housing in recent years. Since the peak in
January of 2006, starts have fallen by more than three-quarters.
November's figure fell short of Consensus expectations for 578,000
starts.
 Last
month, starts of single-family homes recovered
merely 2.1% to 482,000 after October's 7.1% decline. So far this
quarter, starts have fallen 4.2% from the 3Q average. Despite this loss
of forward momentum, single-family starts have recovered
from the February low. During the last ten years, there has been an 84%
correlation between the q/q change in single-family starts and their
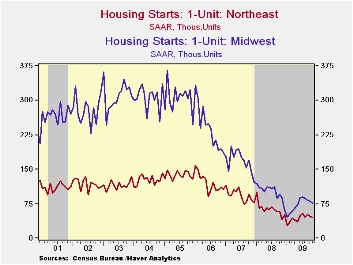
contribution to quarterly GDP growth. The increase in
starts of single-family units was contained to the Southern (12.9% y/y)
and the Western (2.1% y/y) regions of the country. Elsewhere, starts in
the Northeast (2.1% y/y) and in the Midwest (-13.6% y/y) fell
month-to-month.
Last
month, starts of single-family homes recovered
merely 2.1% to 482,000 after October's 7.1% decline. So far this
quarter, starts have fallen 4.2% from the 3Q average. Despite this loss
of forward momentum, single-family starts have recovered
from the February low. During the last ten years, there has been an 84%
correlation between the q/q change in single-family starts and their
contribution to quarterly GDP growth. The increase in
starts of single-family units was contained to the Southern (12.9% y/y)
and the Western (2.1% y/y) regions of the country. Elsewhere, starts in
the Northeast (2.1% y/y) and in the Midwest (-13.6% y/y) fell
month-to-month.
A bit firmer were starts of multi-family units which nearly doubled m/m during November from their record low. Starts of apartments, condominiums & town houses still were down 79.6% from the January 2006 peak.
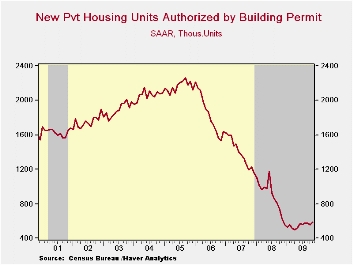 Perhaps
more strength in starts is coming.
Building permits rose 6.0% during November to their highest level in
twelve months. As with starts, permits to build a single-family home
have been relatively strong versus the total. Moreover, they rose 5.3%
versus 3Q they have risen 38.3% from the January low.
Perhaps
more strength in starts is coming.
Building permits rose 6.0% during November to their highest level in
twelve months. As with starts, permits to build a single-family home
have been relatively strong versus the total. Moreover, they rose 5.3%
versus 3Q they have risen 38.3% from the January low.
The housing starts figures can be found in Haver's USECON database.
Housing's Great Fall: Putting Household Balance Sheets Together Again from the Federal Reserve Bank of St. Louis is available here.
| Housing Starts (000s, SAAR) | November | October | September | Nov. Y/Y | 2008 | 2007 | 2006 |
|---|---|---|---|---|---|---|---|
| Total | 574 | 527 | 586 | -12.4% | 900 | 1,342 | 1,812 |
| Single-Family | 482 | 472 | 508 | 5.5 | 616 | 1,036 | 1,474 |
| Multi-Family | 92 | 55 | 78 | -53.5 | 285 | 306 | 338 |
| Building Permits | 584 | 551 | 575 | -7.3 | 895 | 1,392 | 1,844 |

Tom Moeller
AuthorMore in Author Profile »Prior to joining Haver Analytics in 2000, Mr. Moeller worked as the Economist at Chancellor Capital Management from 1985 to 1999. There, he developed comprehensive economic forecasts and interpreted economic data for equity and fixed income portfolio managers. Also at Chancellor, Mr. Moeller worked as an equity analyst and was responsible for researching and rating companies in the economically sensitive automobile and housing industries for investment in Chancellor’s equity portfolio. Prior to joining Chancellor, Mr. Moeller was an Economist at Citibank from 1979 to 1984. He also analyzed pricing behavior in the metals industry for the Council on Wage and Price Stability in Washington, D.C. In 1999, Mr. Moeller received the award for most accurate forecast from the Forecasters' Club of New York. From 1990 to 1992 he was President of the New York Association for Business Economists. Mr. Moeller earned an M.B.A. in Finance from Fordham University, where he graduated in 1987. He holds a Bachelor of Arts in Economics from George Washington University.
More Economy in Brief


