 Global| May 19 2009
U.S. Housing Starts' Fall To Record Low Paced By Lower Multi-family Building
by:Tom Moeller
|in:Economy in Brief
Summary
Falling to the lowest level on record during April, total U.S. housing starts were off by more than one-half from one year ago. The Commerce Department reported that total housing starts of 458,000 (AR) were down 12.8% from March [...]
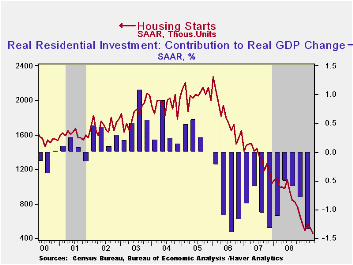
Falling to the lowest level on record during April, total U.S. housing starts were off by more than one-half from one year ago. The Commerce Department reported that total housing starts of 458,000 (AR) were down 12.8% from March after that month's 8.5% decline. Modest revisions to the series extend back to 2007 and the latest figure compares to Consensus expectations for 523,000 starts.
The decline to the record low was led by a 46.1% month-to-month drop in starts of multi-family homes to 90,000. So weak was construction of apartments and condominiums that the decline pulled the level roughly three-quarters below April of last year.
As was the case last month, there is a sign in the latest
report that a bottom in the housing market may be forming. Starts of
single-family homes increased 2.8% from March after two months of
having been unchanged. Regardless, single-family starts remained near
the record low for the series which dates back to 1959 and the latest
level was down eighty percent since the peak in early-2006.
During the last ten years, there has been an 84% correlation between
the q/q change in single-family starts and their contribution to
quarterly GDP growth.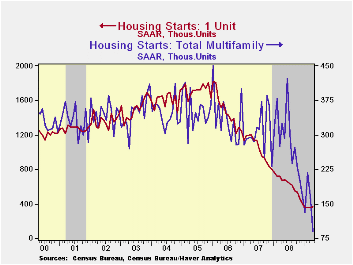
By region, starts of single-family units in the Northeast reversed all of their March rise with a 13.6% (-34.5% y/y) decline. Starts in the Midwest, however, rose to their highest level since November (-36.6% y/y). In the South, single-family starts continued weak. They fell to another record low (-47.6% y/y) but in the West starts jumped 26.6% (-50.6% y/y).
The latest level of building permits also plumbed a new record low last month with a 3.3% decline from March. Overall, permits were down by one-half from last April. Single-family home permits, a leading indicator of starts, however, ticked up 3.6% from March (-42.3% y/y).
The housing starts figures can be found in Haver's USECON database.
U.S. Household Deleveraging and Future Consumption Growth from the Federal Reserve Bank of San Francisco can be found here.
| Housing Starts (000s, SAAR) | April | March | February | Y/Y | 2008 | 2007 | 2006 |
|---|---|---|---|---|---|---|---|
| Total | 458 | 525 | 574 | -54.2% | 900 | 1,342 | 1,812 |
| Single-Family | 368 | 358 | 357 | -45.6 | 616 | 1,036 | 1,474 |
| Multi-Family | 90 | 167 | 217 | -72.3 | 285 | 306 | 338 |
| Building Permits | 494 | 511 | 550 | -50.2 | 895 | 1,392 | 1,844 |
by Tom Moeller May 19, 2009
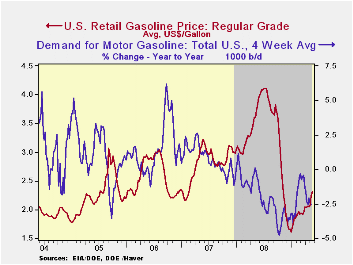
Regular gasoline prices moved even higher
last week. The rise to an average $2.31 per gallon of regular left them
up 70 cents (43.5%) from the December low and it was the highest level
since early-November. Yesterday, cash market prices traded higher still
at $1.77 per gallon versus $1.66 averaged last week and these were the
highest prices since last October. The figures are reported by the U.S.
Department of Energy and can be found in Haver's WEEKLY
& DAILY databases.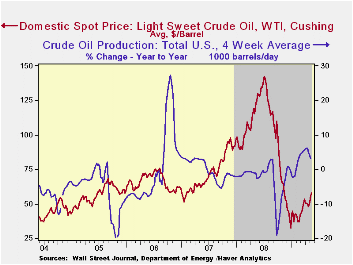
Higher crude oil prices are behind the rise in gasoline costs. Crude prices averaged $58.07 last week for a barrel of West Texas Intermediate, up from the December low of $32.37 per barrel. Yesterday, crude oil prices rose by another $1.00 to $59.03. Prices reached a high of $145.66 last July. The latest increases occurred despite a 3.0% rise in crude oil production during the latest four weeks versus last year. The figures on crude oil production are available in Haver's OILWKLY database.
Higher gasoline prices & economic weakness continued to lower gasoline demand last week by 2.5% y/y. The change in demand is measured using the latest four weeks versus the same four weeks in 2008. Demand for all petroleum products was down 7.9% y/y led by a 41.4% drop in demand for residual fuel oil and a 16.9% drop in distillate demand. In addition, the price gains have occurred despite an 11.0% rise in inventories of crude oil & petroleum products. These numbers are available in Haver's OILWKLY database.
Finally, the price of natural gas has shown life. Gains during the last two weeks raised the price to $4.23 per mmbtu (-62.7% y/y), the highest level since early March. However, still near the lowest level since 2002, the latest average price was down by two-thirds from the high reached in early-July of $13.19/mmbtu.
The Effect of the Fed's Purchase of Long-Term Securities on the Yield Curve from the Federal Reserve Bank of St. Louis can be found here.
| Weekly Prices | 05/18/09 | 05/11/09 | Y/Y | 2008 | 2007 | 2006 |
|---|---|---|---|---|---|---|
| Retail Regular Gasoline ($ per Gallon, Regular) | 2.31 | 2.24 | -39.1% | 3.25 | 2.80 | 2.57 |
| Light Sweet Crude Oil, WTI ($ per bbl.) | 58.07 | 51.07 | -54.5% | 100.16 | 72.25 | 66.12 |
by Tom Moeller May 19, 2009
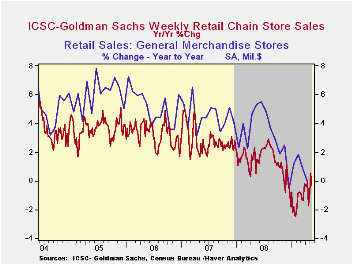
According to the International Council of Shopping Centers-Goldman Sachs Index, store sales stuttered last week and reversed all of the gains early in the month. In fact weekly sales fell to their lowest since late-March. For the month so far, chain store sales are down just slightly from April after that month's 1.4% rise from the March average.
During the last ten years there has been a 64% correlation between the year-to-year growth in chain store sales and the growth in general merchandise sales. These weekly figures are available in Haver's SURVEYW database.
The ICSC-Goldman Sachs retail chain-store sales index is constructed using the same-store sales (stores open for one year) reported by 78 stores of seven retailers: Dayton Hudson, Federated, Kmart, May, J.C. Penney, Sears and Wal-Mart.
Not only did sales decline, but the leading indicator of sales fell as well and reversed earlier increases. Nevertheless, the y/y change remained less depressed at -2.4% versus the 6.0% rate of decline last Fall.
Comparing patterns of default among prime and subprime mortgages from the Federal Reserve Bank of Chicago is available here.
| ICSC-UBS (SA, 1977=100) | 05/16/09 | 05/09/09 | Y/Y | 2008 | 2007 | 2006 |
|---|---|---|---|---|---|---|
| Total Weekly Chain Store Sales | 486.8 | 492.7 | -0.3% | 1.4% | 2.8% | 3.3% |
by Louise Curley May 19, 2009
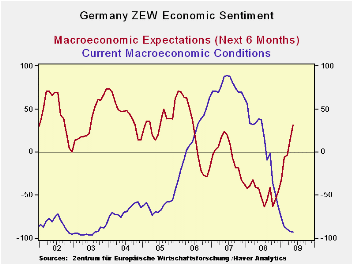 While
continuing to be pessimistic about current conditions, German investors
and financial analysts have become surprisingly more optimistic about
the economic outlook over the next six months. The
ZEW indicator of current economic conditions in May declined a further
1.2% and is now at a balance between pessimists and optimists of
-92.8%, close to the lowest on record, -96.1% in March 2003. The
indicator of sentiment for the economic outlook for the next six
months, however, rose sharply in May to 31.1% from 13.6% in April and
is now at a three year high and is above the long term average of
26.2%.
While
continuing to be pessimistic about current conditions, German investors
and financial analysts have become surprisingly more optimistic about
the economic outlook over the next six months. The
ZEW indicator of current economic conditions in May declined a further
1.2% and is now at a balance between pessimists and optimists of
-92.8%, close to the lowest on record, -96.1% in March 2003. The
indicator of sentiment for the economic outlook for the next six
months, however, rose sharply in May to 31.1% from 13.6% in April and
is now at a three year high and is above the long term average of
26.2%. 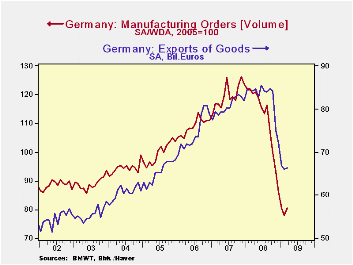
Among the factors that may have accounted for some of the improvement in the outlook of the participants in the survey, which was conducted between May 4th and May 18 was the ongoing rise in stock prices that had begun in early March. By May 18, the Frankfurt Extra Dax stock price index was up over 30% from the low on March 6. In addition, there were the releases of March exports and new orders showing the first month to month increases since early 2008, as shown in the second chart. The year to year declines in these series of 21.7% and 33.1%, respectively, probably were important factors in the appraisal of current conditions.
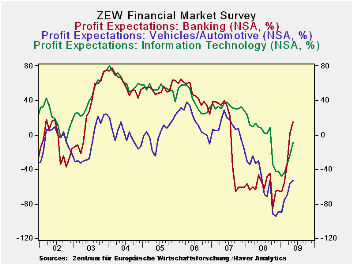 While the
participants in the survey, still
expect profits in most industries to decline, they have moderated their
views on the declines and they expect profits in Banking and Insurance
to increase. The third chart shows the profit expectations
for the Banking, Automotive and Information Technology
industries.
While the
participants in the survey, still
expect profits in most industries to decline, they have moderated their
views on the declines and they expect profits in Banking and Insurance
to increase. The third chart shows the profit expectations
for the Banking, Automotive and Information Technology
industries.
| ZEW Indicators % Bal | May 09 | Apr 09 | Mar 09 | Feb09 | Jan 09 |
|---|---|---|---|---|---|
| Current Macroeconomic Conditions | -92.8 | -91.6 | -89.1 | -86.2 | -77.1 |
| Macroeconomic Expectations 6 M0 ahead | 31.1 | 13.0 | -3.5 | -5.8 | -31.0 |
| Mar 09 | Feb 09 | Jan 09 | M/M% | Y/Y% | |
| Exports (Bil Euros) | 66.42 | 65.97 | 84.15 | 0.68 | -21.70 |
| New Orders (2005=100) | 80.5 | 72.9 | 120.3 | 3.34 | -33.08 |

Tom Moeller
AuthorMore in Author Profile »Prior to joining Haver Analytics in 2000, Mr. Moeller worked as the Economist at Chancellor Capital Management from 1985 to 1999. There, he developed comprehensive economic forecasts and interpreted economic data for equity and fixed income portfolio managers. Also at Chancellor, Mr. Moeller worked as an equity analyst and was responsible for researching and rating companies in the economically sensitive automobile and housing industries for investment in Chancellor’s equity portfolio. Prior to joining Chancellor, Mr. Moeller was an Economist at Citibank from 1979 to 1984. He also analyzed pricing behavior in the metals industry for the Council on Wage and Price Stability in Washington, D.C. In 1999, Mr. Moeller received the award for most accurate forecast from the Forecasters' Club of New York. From 1990 to 1992 he was President of the New York Association for Business Economists. Mr. Moeller earned an M.B.A. in Finance from Fordham University, where he graduated in 1987. He holds a Bachelor of Arts in Economics from George Washington University.
More Economy in Brief


