 Global| May 18 2009
U.S. Home Builders' Index Increases Again
by:Tom Moeller
|in:Economy in Brief
Summary
The pressure is diminishing in the U.S. housing market according to the National Association of Home Builders. Their May index of sales rose to 16, its highest level since last September and up from an upwardly revised April level. [...]
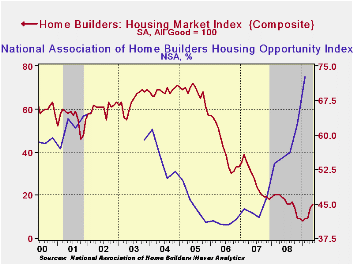
The pressure is diminishing in the U.S. housing market
according to the National Association of Home Builders. Their May index
of sales rose to 16, its highest level since last September and up from
an upwardly revised April level. The index is compiled from survey
questions asking builders to rate market conditions as “good”, “fair”,
“poor” or “very high” to “very low”. Numerical
results over 50 indicate a predominance of “good” readings. 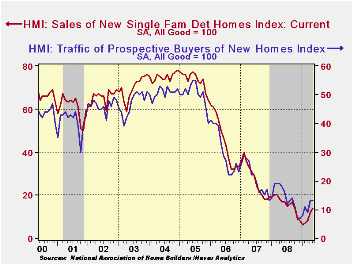
The Home Builders Association indicated that its sub-index of present sales rose to a reading of 14 from the upwardly revised April figure. The latest improvement lifted the index to just below last year's average level of 16.Since 1990, the year-to-year change in this index has had an 80% correlation with the year-to-year percentage change in new single-family home sales.
The index of builders’ expectations for home sales in six months also rose to its highest since September. However, the “traffic" of prospective buyers was unchanged from April but still up from the record lows of this past Winter.
Index readings in each of the country's regions have improved from the recent lows.
Individuals' assessment of conditions for remodeling also have improved. The conditions for major and minor alterations rose in the first quarter to the highest level in nearly one year and expectations rose as well.
During the fourth quarter the Home Builders' Housing Opportunity Index, which is the share of homes sold that could be considered affordable to a family earning the median income, rose even higher to its highest level since early 2002. It was up by nearly one half from the 2006 low due to lower home prices, lower interest rates and higher income. (There is a break in the series from 2002 to 2003.)
The NAHB has compiled the Housing Market Index since 1985. The weights assigned to the individual index components are .5920 for single family detached sales, present time; .1358 for single family detached sales, next six months; and .2722 for traffic of prospective buyers. The results, along with other housing and remodeling indexes from NAHB Economics, are included in Haver’s SURVEYS database.
The Role of Information in the Rise in Consumer Bankruptcies from the Federal Reserve Bank of Richmond is available here.
| Nat'l Association of Home Builders | May | April | May '08 | 2008 | 2007 | 2006 |
|---|---|---|---|---|---|---|
| Composite Housing Market Index (All Good = 100) | 16 | 14 | 19 | 16 | 27 | 42 |
| Single-Family Sales | 14 | 12 | 17 | 16 | 27 | 45 |
| Single-Family Sales: Next Six Months | 27 | 24 | 28 | 25 | 37 | 51 |
| Traffic of Prospective Buyers | 13 | 13 | 18 | 14 | 21 | 30 |
by Robert Brusca May 18, 2009
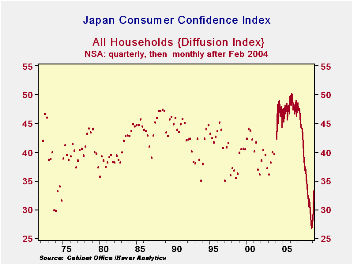
Japan’s consumer confidence index is up for the fourth month
running. It is now a monthly reading - that accounts for the history of
dots on the chart which represent unconnected quarterly observations
ahead of the adoption of monthly surveys. The current reading for the
index is in the bottom third to quarter of its historic range, a low
position, but well off from its worst in this cycle. Notably, over the
last three months there have been sharp improvements in the overall
livelihood assessment. Income growth, Employment, Willingness to buy
durables, and Value of assets responses, all have risen over that
period. Of these, income growth is still the lowest in its range
standing in the bottom 11th- to 15th percentile depending on the period
for that calculation. Employment and value of assets responses lie just
below the boundary for the lower range quartile. Willingness to buy
durable goods is, however, much stronger in its range and is closer to
the midpoint at the 45th range percentile.
Clearly there has been improvement in the Japanese consumer’s
assessment of the economy. Just as clearly the current readings on the
consumer’s feeling about the economy are poor. For now after such a
lengthy period of deterioration what is notable is the ongoing
improvement in these measures and quite a notable step of improvement
across the various responses. However bad off things are in Japan, they
are perceived to be getting better. Importantly these assessments are
not so beleaguered for spending any more.
| Japan Consumer Confidence | Percentile | |||||||
|---|---|---|---|---|---|---|---|---|
| monthly | Change over | of range* | ||||||
| Apr-09 | Mar-09 | Feb-09 | 3-mos | 6-mos | 12-Mos | Since 2004 | Since 1988 | |
| Overall Livelihood | 33.8 | 31.1 | 29.4 | 4.6 | 4.2 | 0.8 | 28.6 | 26.1 |
| Income growth | 33.4 | 32.0 | 31.1 | 2.0 | -1.1 | -4.1 | 15.1 | 11.1 |
| Employment | 23.3 | 18.3 | 14.9 | 9.1 | -1.5 | -12.7 | 22.2 | 22.2 |
| Willing to buy Durable Goods | 39.0 | 34.2 | 31.4 | 8.4 | 10.2 | 4.8 | 45.9 | 45.3 |
| Value of Assets | 32.2 | 28.8 | 28.7 | 4.1 | 3.2 | -4.1 | 22.4 | 22.4 |
| For two-person households; * Percentiles since Mar 2004 when series became monthly or full period | ||||||||
by Louise Curley May 18, 2009
 While
faint signs of recovery have begun to appear in various
parts of the world, few have appeared in Eastern Europe and this
remains the case with today's reports from Eastern Europe that include
industrial production in Russia and the Ukraine, the labor force in
Slovenia and construction in Hungary.
While
faint signs of recovery have begun to appear in various
parts of the world, few have appeared in Eastern Europe and this
remains the case with today's reports from Eastern Europe that include
industrial production in Russia and the Ukraine, the labor force in
Slovenia and construction in Hungary.
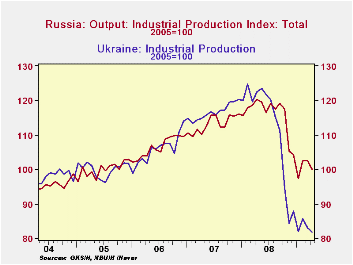
 Russia reported that industrial production in April declined
16.8% from April, 2008, greater than the 13.7% year to year decline of
March. This was the sixth consecutive decline and the largest recorded
since the Federal Statistical Service revised its methodology in 2003.
Production in manufacturing has shown similar trends but the declines
have been significantly bigger. In April, manufacturing production was
25.3% below April 2008.
Russia reported that industrial production in April declined
16.8% from April, 2008, greater than the 13.7% year to year decline of
March. This was the sixth consecutive decline and the largest recorded
since the Federal Statistical Service revised its methodology in 2003.
Production in manufacturing has shown similar trends but the declines
have been significantly bigger. In April, manufacturing production was
25.3% below April 2008.
The decline in production in Ukraine has been steeper than
that in Russia and in April was 33.5% below April of 2008, compared
with a shortfall of 30.8% in March. 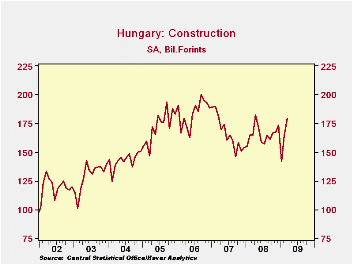 The first chart shows industrial
production in Russia and Ukraine.
The first chart shows industrial
production in Russia and Ukraine.
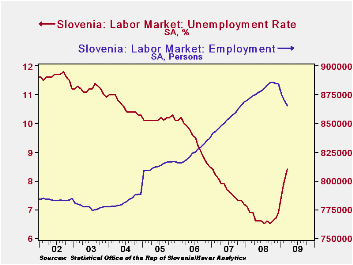
The monthly decline in employment in Slovenia is slowing up. It was 4,635 in March, compared with 5,056 in February and 9,187 in January, but the unemployment rate continues to climb and was 8.4% in March. Slovenia's level of employment and the unemployment rate are shown in the second chart.
| EASTERN EUROPE | Apr 09 | Mar 09 | Feb 09 | Jan 09 | Y/Y Chg | Y/Y Chg | Y/Y Chg | Y/Y Chg |
|---|---|---|---|---|---|---|---|---|
| Apr 09 | Mar 09 | Feb 09 | Jan 09 | |||||
| Russia IP 2005=100 | 100.1 | 102.4 | 102.5 | 97.4 | -16.8% | -13.7% | -13.2% | -16.0% |
| Ukraine IP2005=100 | 80.4 | 84.5 | 78.0 | 73.9 | -33.5% | -30.8% | -31.4% | -31.8% |
| Hungary Construction Exp Bil of Forints | -- | 179.7 | 164.1 | 142.1 | -- | 8.6% | -1.2% | -9.4% |
| Slovenia Unemp Rate (%) | -- | 8.4 | 8.0 | 7.5 | -- | -- | -- | -- |
| Slovenia Employ Persons | -- | 865,459 | 870,094 | 875,150 | -- | -4635* | -5056* | -9187* |
| * month to month change | ||||||||

Tom Moeller
AuthorMore in Author Profile »Prior to joining Haver Analytics in 2000, Mr. Moeller worked as the Economist at Chancellor Capital Management from 1985 to 1999. There, he developed comprehensive economic forecasts and interpreted economic data for equity and fixed income portfolio managers. Also at Chancellor, Mr. Moeller worked as an equity analyst and was responsible for researching and rating companies in the economically sensitive automobile and housing industries for investment in Chancellor’s equity portfolio. Prior to joining Chancellor, Mr. Moeller was an Economist at Citibank from 1979 to 1984. He also analyzed pricing behavior in the metals industry for the Council on Wage and Price Stability in Washington, D.C. In 1999, Mr. Moeller received the award for most accurate forecast from the Forecasters' Club of New York. From 1990 to 1992 he was President of the New York Association for Business Economists. Mr. Moeller earned an M.B.A. in Finance from Fordham University, where he graduated in 1987. He holds a Bachelor of Arts in Economics from George Washington University.
More Economy in Brief


