 Global| Dec 22 2009
U.S. GDP Revised Downward:Domestic Demand & Inventories Are Shaved
by:Tom Moeller
|in:Economy in Brief
Summary
The second revision to 3Q U.S. real GDP lowered growth again, this time to 2.2% (AR) from last month's report of 2.9% growth. The revised figure compares to the advance report of 3.5% growth and was contrary to expectations for an [...]
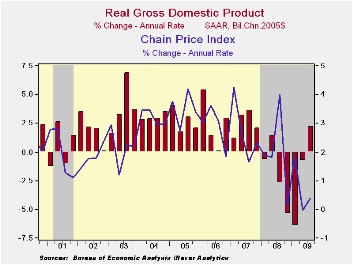 The second
revision to 3Q U.S. real GDP lowered growth again, this time to 2.2%
(AR) from last month's report of 2.9% growth. The revised figure
compares to the advance report of 3.5% growth and was contrary to
expectations for an improvement to 2.8%. Still, growth last quarter was
the first positive figure since 4Q 2007. Estimates of economic growth
this quarter recently have been rising to roughly 4.0%.
The second
revision to 3Q U.S. real GDP lowered growth again, this time to 2.2%
(AR) from last month's report of 2.9% growth. The revised figure
compares to the advance report of 3.5% growth and was contrary to
expectations for an improvement to 2.8%. Still, growth last quarter was
the first positive figure since 4Q 2007. Estimates of economic growth
this quarter recently have been rising to roughly 4.0%.
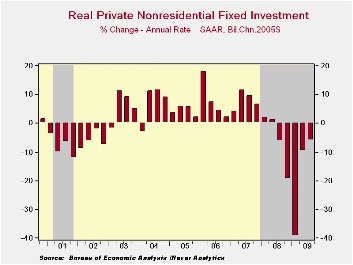
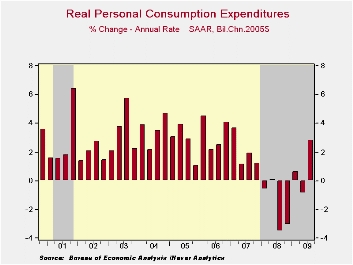 The
largest surprise in the revision was that domestic final demand growth
was again revised down, to 2.3% from 2.7%. On the fixed-investment
side, business fixed investment fell at an increased 5.9% (-19.6% y/y)
rate. The quarterly rise in residential spending was reduced to 18.9%
(-18.9% y/y) and government investment grew at a reduced 2.7% rate
(2.0% y/y). Real PCE growth was little changed at 2.8% (-0.2% y/y).
The
largest surprise in the revision was that domestic final demand growth
was again revised down, to 2.3% from 2.7%. On the fixed-investment
side, business fixed investment fell at an increased 5.9% (-19.6% y/y)
rate. The quarterly rise in residential spending was reduced to 18.9%
(-18.9% y/y) and government investment grew at a reduced 2.7% rate
(2.0% y/y). Real PCE growth was little changed at 2.8% (-0.2% y/y).
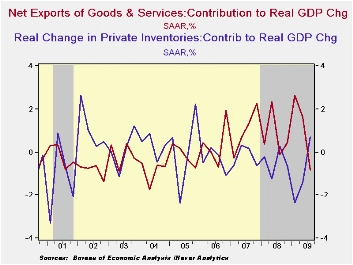 Another
surprise in the figures was
that the 3Q contribution to GDP growth from inventories was revised
lower to 0.7 percentage points. Nevertheless, the 3Q addition followed
subtractions of 1.4 and 2.4 percentage points during the prior two
quarters, and was just the second positive contribution to GDP growth
in two years.
Another
surprise in the figures was
that the 3Q contribution to GDP growth from inventories was revised
lower to 0.7 percentage points. Nevertheless, the 3Q addition followed
subtractions of 1.4 and 2.4 percentage points during the prior two
quarters, and was just the second positive contribution to GDP growth
in two years.
Accompanying the GDP figure was a little-revised estimate that 3Q corporate profits rose 10.8% versus 2Q. That was the third consecutive quarterly increase and diminished the y/y change to -6.6% from -25.1% at its worst in 4Q' 08. Lower market interest rates lifted earnings in the financial sector by more than one-third (20.5% y/y) and they tripled from year-end '08. Earnings from the rest of the world increased 7.3% (-18.6% y/y) while the end of the recession raised domestic nonfinancial profits by an upwardly revised 4.2% (-10.6% y/y) for the second quarterly increase.
 Deterioration
in the foreign trade deficit subtracted an unrevised 0.8 percentage
points from 3Q GDP growth following an advance estimate of a
0.5% subtraction. Imports grew 21.3% (-14.0% y/y) and the gain in
exports also was little-revised at 17.8% (-10.7% y/y).
Deterioration
in the foreign trade deficit subtracted an unrevised 0.8 percentage
points from 3Q GDP growth following an advance estimate of a
0.5% subtraction. Imports grew 21.3% (-14.0% y/y) and the gain in
exports also was little-revised at 17.8% (-10.7% y/y).
The gain in the GDP price deflator was lowered slightly to 0.4%. The PCE price index was ticked lower to 2.6% (-0.7% y/y) and the rise in the overall domestic final sales price index was brought down to 1.4% (-1.0% y/y).
The U.S. National Income & Product Account data are available in Haver's USECON and the USNA databases.
| Chained 2005$, % AR | 3Q '09 Final | 3Q '09 Preliminary | 3Q '09 Advance | 2Q '09 | 1Q '09 | 2Q Y/Y | 2008 | 2007 | 2006 |
|---|---|---|---|---|---|---|---|---|---|
| GDP | 2.2 | 2.4 | 3.5 | -0.7 | -6.4 | -2.6 | 0.4 | 2.1 | 2.7 |
| Inventory Effect | 0.7 | 0.9 | 0.9 | -1.4 | -2.4 | -0.9 | -0.4 | -0.4 | 0.1 |
| Final Sales | 1.5 | 1.9 | 2.6 | 0.7 | -4.1 | -1.7 | 0.8 | 2.5 | 2.6 |
| Foreign Trade Effect | -0.8 | -0.8 | -0.5 | 1.7 | 2.6 | 0.8 | -1.2 | 0.8 | 0.1 |
| Domestic Final Demand | 2.3 | 2.7 | 3.0 | -0.9 | -6.4 | -2.5 | -0.4 | 1.7 | 2.5 |
| Chained GDP Price Index | 0.4 | 0.5 | 0.8 | -0.0 | 1.9 | 0.6 | 2.1 | 2.9 | 3.3 |
by Tom Moeller December 22, 2009
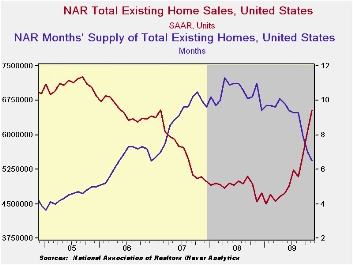 The
front-end of the economy is improving markedly. The National
Association of Realtors reported that November sales of
existing homes again rose sharply to the highest level since
February 2007. The 7.4% m/m increase to 6.540M units (SAAR) followed a
little-revised 9.9% rise during October. The latest was the fourth
strong gain in five months and it raised sales 45.7% from the January
low. The gain in November home sales greatly exceeded Consensus
expectations for a rise to 6.25M.
The
front-end of the economy is improving markedly. The National
Association of Realtors reported that November sales of
existing homes again rose sharply to the highest level since
February 2007. The 7.4% m/m increase to 6.540M units (SAAR) followed a
little-revised 9.9% rise during October. The latest was the fourth
strong gain in five months and it raised sales 45.7% from the January
low. The gain in November home sales greatly exceeded Consensus
expectations for a rise to 6.25M.
Total sales include sales of condos and co-ops. Sales of existing single-family homes alone increased a sharp 8.5% to 5.770M (42.1% y/y) last month and were up 42.5% from the January low. (These data have a longer history than the total sales series). Sales of condos and co-ops were unchanged m/m and were up by 60.1% from last November.
Sales have been helped by a recently extended tax credit for first-time home buyers. The credit of up to $8,000 now runs though early next year. The full details of the home-buyer tax credit can be found here.
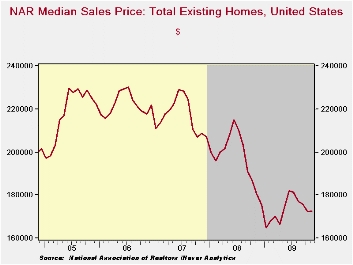 The median
price of all existing homes rose
slightly to $172,600 after
four consecutive months of decline. Nevertheless, the y/y
decline moderated to 4.3% from its worst of -17.5% as of
January and prices have risen 4.7% from the low. The median price for a
single-family home alone was little-changed at $171,900 (-4.4% y/y).
Price weakness has sharply raised home affordability; by 7.2% since
July and by roughly two-thirds from the 2006 low.
The median
price of all existing homes rose
slightly to $172,600 after
four consecutive months of decline. Nevertheless, the y/y
decline moderated to 4.3% from its worst of -17.5% as of
January and prices have risen 4.7% from the low. The median price for a
single-family home alone was little-changed at $171,900 (-4.4% y/y).
Price weakness has sharply raised home affordability; by 7.2% since
July and by roughly two-thirds from the 2006 low.
The number of unsold homes (single-family & co-ops) for sale fell 1.3% (-15.5% y/y) during November and to the lowest level since December 2006. At the current sales rate there was a 6.5 months' supply of homes on the market which was the lowest since December 2006. The latest figure was down from a high of 11.3 months during April of last year. For single-family homes, the inventory fell to a 6.2 month's supply, also the lowest since December 2006.
The data on existing home sales, prices and affordability can be found in Haver's USECON database. The regional price, affordability and inventory data is available in the REALTOR database.
| Existing Home Sales (Thous, SAAR) | November | October | September | Nov. Y/Y | 2008 | 2007 | 2006 |
|---|---|---|---|---|---|---|---|
| Total | 6,540 | 6,090 | 5,540 | 44.1% | 4,893 | 5,674 | 6,516 |
| Northeast | 1,130 | 1,060 | 950 | 52.7 | 845 | 1,010 | 1,093 |
| Midwest | 1,550 | 1,430 | 1,250 | 53.5 | 1,130 | 1,331 | 1,494 |
| South | 2,390 | 2,280 | 2,040 | 44.8 | 1,860 | 2,243 | 2,577 |
| West | 1,460 | 1,320 | 1,290 | 28.1 | 1,064 | 1,095 | 1,357 |
| Single-Family | 5,770 | 5,320 | 4,860 | 42.1 | 4,341 | 4,960 | 5,712 |
| Median Price, Total, $ (NSA) | 172,600 | 172,200 | 176,000 | -4.3 | 197,233 | 216,633 | 222,042 |
by Tom Moeller December 22, 2009
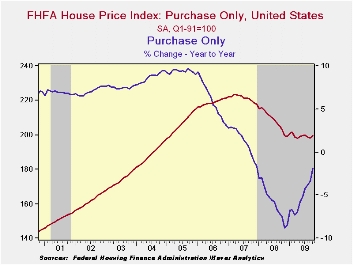
Improvement in housing prices continued this fall according the U.S. House Price Index from the Federal Housing and Finance Agency (FHFA). The Purchase Only Index for October rose 0.6% and reversed its September. Nevertheless, the year-to-year decline in the nationwide average of home prices eased to -1.9% from its worst reading of -8.8% last November. Since their peak in early-2007 home prices nationwide have fallen 10.7%. The FHFA uses data provided by Fannie Mae and Freddie Mac and is not value-weighted.
 The HPI is calculated using a repeat sales index. That means
that the HPI measures changes in the price of the same property over
time but does not measure changes in property types over time. So if,
for example, the price of a larger, new home was not growing very
rapidly, but the number of people transitioning from smaller homes to
larger homes greatly increased, median house prices would go up (people
buying more expensive houses) much more than the HPI. In this way, the
HPI is a better measure of how any particular home is appreciating
while the median house price is a better measure of what the typical
home buyer is paying.
The HPI is calculated using a repeat sales index. That means
that the HPI measures changes in the price of the same property over
time but does not measure changes in property types over time. So if,
for example, the price of a larger, new home was not growing very
rapidly, but the number of people transitioning from smaller homes to
larger homes greatly increased, median house prices would go up (people
buying more expensive houses) much more than the HPI. In this way, the
HPI is a better measure of how any particular home is appreciating
while the median house price is a better measure of what the typical
home buyer is paying.
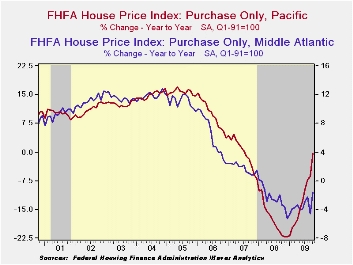
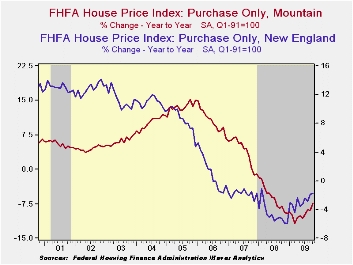 Notable monthly gains in home prices during October were
logged in the Pacific, Middle Atlantic and the East South Central
regions of the country and the y/y declines have moderated
significantly. In the populous East North Central region prices slipped
another 0.6% during October and they were flat year-to-date. Prices
also fell sharply in the South Atlantic region to the lowest level
since 2004.
Notable monthly gains in home prices during October were
logged in the Pacific, Middle Atlantic and the East South Central
regions of the country and the y/y declines have moderated
significantly. In the populous East North Central region prices slipped
another 0.6% during October and they were flat year-to-date. Prices
also fell sharply in the South Atlantic region to the lowest level
since 2004.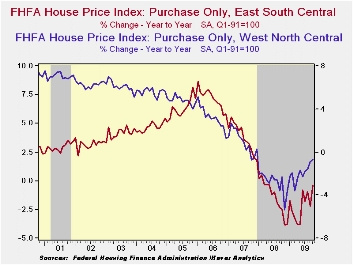
| FHFA U.S. House Price Index Purchase Only (%) | October | September | Y/Y | 2008 | 2007 | 2006 |
|---|---|---|---|---|---|---|
| Total | 0.6 | -0.4 | -1.9 | -5.8 | 1.3 | 6.0 |
| New England | 0.0 | 0.3 | -1.8 | -4.6 | -1.7 | 1.1 |
| Middle Atlantic | 1.8 | -1.5 | -1.6 | -2.3 | 1.9 | 6.3 |
| East North Central | -0.6 | -0.7 | -1.9 | -4.4 | -1.3 | 1.8 |
| West North Central | 0.2 | 0.0 | -0.7 | -2.8 | 1.0 | 3.2 |
| South Atlantic | -1.1 | 0.2 | -4.1 | -7.2 | 1.3 | 7.1 |
| East South Central | 1.6 | -1.5 | -0.4 | -1.4 | 3.8 | 7.2 |
| West South Central | 0.5 | -0.3 | 0.0 | 0.6 | 4.7 | 7.2 |
| Mountain | 0.8 | -1.4 | -7.5 | -6.1 | 3.9 | 10.6 |
| Pacific | 3.7 | -0.9 | -0.3 | -17.3 | 0.1 | 9.8 |
by LouiseCurley December 22, 2009
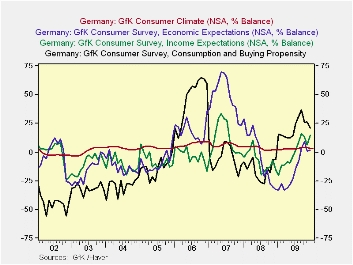
According to the latest GfK* survey, the German Consumer Climate is cooling, not that it was recently especially warm. Based on consumers' appraisals of the outlooks for the economy and their personal situation and their willingness to spend in the current month, GfK forecasts the Consumer Climate in the month ahead. Currently, they are forecasting a decline in the Consumer Climate Indicator to 3.3% in January. This is the third decline in the indicator from the 4.2% reached in October, 2009. Since it began in January, 2002, the indicator has been within a fairly narrow range, from a high of 9.1% recorded in November and December of 2006 to a low of -3.5%, recorded in March, 2003.
The balance of opinion of German Consumers on Economic Expectations improved from -1.7% in November to 0.9% in December, but was still well below the 8.7% of October. The balance of opinion on Income Expectations more than doubled from 6.2% in November to 15.0% in December. However, the balance of opinion on the Consumption and Buying Propensity declined significantly from 26.3% in November to 21.1% in December and is now well below the recent peak of 36.5% in September. It appears that the decline in the balance of opinion on the Consumption and Buying Propensity is the major cause of the decline in the Consumer Climate.
The component parts of the Climate Indicator have shown much greater variation than the over all indicator. In contrast to the narrow range of the Consumer Climate indicator, cited above, the balance of opinion on Economic Expectations has ranged from a high of 69.5% in May, 2007 to a low of -32/9 in January, 2009. The balance of opinion for Income Expectations has ranged from 33.6% in May 2007 to -24.5% in November, 2002 and for Consumption and Buying Propensity, from a high of 64.4% in October 2006. to a low of -55.4% in November 2002. All four indicators are shown in the attached chart.*GfK Gesellschaft fur Konsumforschung (Company for Consumer Research)
| GFK Consumer Climate Survey | Jan 10 | Dec 09 | Nov 09 | Oct 09 | Sep 09 | Aug 09 | Jul 09 | Jun 09 | May 09 |
|---|---|---|---|---|---|---|---|---|---|
| Consumer Climate (% balance) | 3.3 | 3.6 | 3.9 | 4.2 | 3.8 | 3.4 | 3.0 | 2.7 | 2.5 |
| Economic Expectations | -- | 1.7 | 0.9 | 8.7 | 3.4 | -7.5 | -14.0 | -26.6 | -28.3 |
| Income Expectations | -- | 15.0 | 6.2 | 12.9 | 16.0 | 8.8 | 1.8 | -3.3 | -9.3 |
| Consumption and Buying Propensity | -- | 21.2 | 26.3 | 26.1 | 36.5 | 31.1 | 25.1 | 14.5 | 12.5 |

Tom Moeller
AuthorMore in Author Profile »Prior to joining Haver Analytics in 2000, Mr. Moeller worked as the Economist at Chancellor Capital Management from 1985 to 1999. There, he developed comprehensive economic forecasts and interpreted economic data for equity and fixed income portfolio managers. Also at Chancellor, Mr. Moeller worked as an equity analyst and was responsible for researching and rating companies in the economically sensitive automobile and housing industries for investment in Chancellor’s equity portfolio. Prior to joining Chancellor, Mr. Moeller was an Economist at Citibank from 1979 to 1984. He also analyzed pricing behavior in the metals industry for the Council on Wage and Price Stability in Washington, D.C. In 1999, Mr. Moeller received the award for most accurate forecast from the Forecasters' Club of New York. From 1990 to 1992 he was President of the New York Association for Business Economists. Mr. Moeller earned an M.B.A. in Finance from Fordham University, where he graduated in 1987. He holds a Bachelor of Arts in Economics from George Washington University.
More Economy in Brief


