 Global| Apr 29 2009
U.S. GDP Declines 6.1% In 1Q As Inventory Cutbacks Weigh Heavily
by:Tom Moeller
|in:Economy in Brief
Summary
Businesses worked with a vengeance last quarter to reduce levels of unwanted inventory. The 6.1% (AR) drop in real GDP was about the same as during 4Q '08, but together the back-to-back declines were the worst since early-1958. [...]
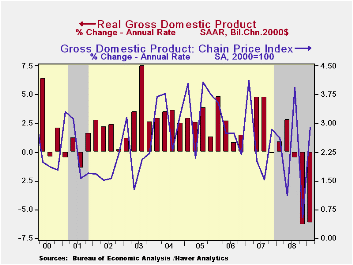
Businesses worked with a vengeance last quarter to reduce levels of unwanted inventory. The 6.1% (AR) drop in real GDP was about the same as during 4Q '08, but together the back-to-back declines were the worst since early-1958. Consensus expectations had been for a 1Q decline of roughly 5.0%.
Cutbacks of unwanted levels of inventory, which built up as demand cratered during last year's second half, subtracted 2.8 percentage points from GDP growth. That was the most since the first quarter of 2000 and it rivals the biggest negative contribution from inventories since the early-1980s.
The correction followed an unwanted inventory buildup late
during 2008 as demand fell sharply. Real U.S. final sales to domestic
purchasers contracted at a 5.1% annual rate that was little different
from the 4Q decline. Together, these declines also were the sharpest
since 1958. However, the latest decline in overall demand took on
somewhat of a different composition. 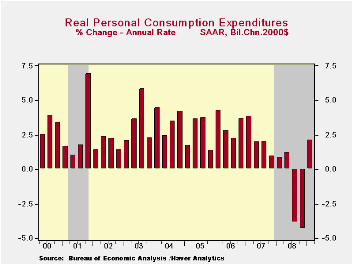
Personal consumption expenditures actually rose at a 2.2% annual rate (-1.2% y/y) last quarter and that reversed a bit of the decline during the prior two periods. Spending on motor vehicles rose moderately during the quarter (-18.5% y/y) after five consecutive down periods. Business fixed investment fell at a 21.7% rate (-5.2% y/y) and residential investment dropped at a 22.8% rate (-19.4% y/y) from Q4.Spending on furniture also rose (-0.1% y/y) and reversed a piece of the declines during the prior two quarters.
Elsewhere the pattern of severe weakness in activity continued or intensified. Residential investment fell at a 38.0% annual rate (-23.2% y/y) last quarter. Housing investment has fallen steadily since its peak in late 2005 but the 1Q drop was the sharpest during the period. Business investment also has fallen sharply but here again the rate of decline intensified. The 37.9% (AR) drop last quarter (-16.3% y/y) set a new record for the postwar period.
The shortfall in overall GDP growth last quarter owed much to
a 3.9% drop (+1.7% y/y) in expenditures by the government sector. It
was the first decline since late 2005 and it was led by a surprising
4.0% drop (+5.6% y/y) drop in Federal spending. That was paced by a
6.4% decline (+5.2% y/y) in defense expenditures. State and local
spending also fell at a 3.9% annual rate -0.6% y/y).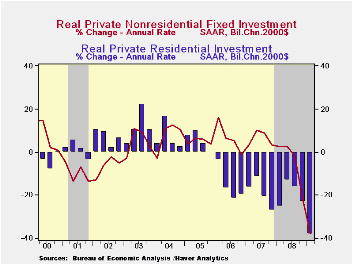
If there was any solace in the GDP report it was in the foreign trade sector where net exports contributed 2.0 percentage points to 1Q GDP growth. But there was no real positive news here either, just that imports fell somewhat more than exports. Imports fell at a 34.% annual rate (-16.5% y/y) while U.S. exports fell at a 3.0% rate (-11.3% y/y).
Even the inflation news was not great. The 2.9% increase in the GDP chain price index was up from the 0.5% annual rate of increase during 4Q. The reason for the rise was that import prices fell at a faster rate than export prices. Domestic prices, however, reflected the weak economy. The PCE price index fell at a 1.0% annual rate while the residential investment chain price index fell at a 4.8% rate (-5.3% y/y). The weakness in business caused the nonresidential investment price index also to slip at a 0.9% rate (+2.5% y/y), the first decline since 2007.
The U.S. National Income & Product Account data is available in Haver's USECON and the USNA databases.
| Chained 2000$, % AR | 1Q '09 (Advance) | 4Q '08 | 1Q Y/Y | 2008 | 2007 | 2006 |
|---|---|---|---|---|---|---|
| GDP | -6.1 | -6.3 | -2.6 | 1.1 | 2.0 | 2.8 |
| Inventory Effect | -2.8 | -0.1 | -0.9 | 0.1 | -0.4 | 0.0 |
| Final Sales | -3.4 | -6.2 | -1.7 | 1.4 | 2.4 | 2.8 |
| Foreign Trade Effect | 2.0 | -0.2 | -1.3 | 1.4 | 0.6 | 0.2 |
| Domestic Final Demand | -5.1 | -5.8 | -3.0 | -0.0 | 1.8 | 2.6 |
| Chained GDP Price Index | 2.9 | 0.5 | 2.1 | 2.2 | 2.7 | 3.2 |
by Tom Moeller April 29, 2009
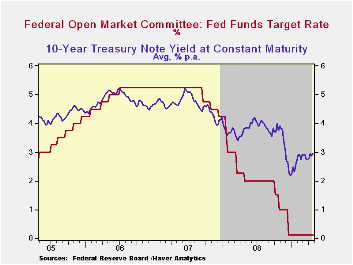
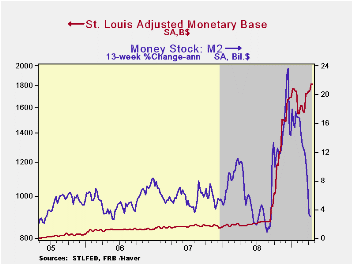
In an anticipated move the Federal Open Market Committee today left the Federal funds rate in a "range from 0 to 1/4 percent." The discount also was left unchanged at 0.50%. The Fed funds rate remained the lowest ever. The decision was unanimous amongst FOMC voters.
The Fed indicated that "Household spending has shown signs of stabilizing but remains constrained by ongoing job losses, lower housing wealth and tight credit." Moreover, the Fed pointed out that while "the economic outlook has improved modestly since the March meeting, partly reflecting some easing of financial market conditions, economic activity is likely to remain weak for a time. Nonetheless, the Committee continues to anticipate that policy actions to stabilize financial markets and institutions, fiscal and monetary stimulus, and market forces will contribute to a gradual resumption of sustainable economic growth in a context of price stability."
 Regarding
inflation the same statement was offered as at the last meeting. "...
that inflation will remain subdued. Moreover, the Committee sees some
risk that inflation could persist for a time below rates that best
foster economic growth and price stability in the longer term.
Regarding
inflation the same statement was offered as at the last meeting. "...
that inflation will remain subdued. Moreover, the Committee sees some
risk that inflation could persist for a time below rates that best
foster economic growth and price stability in the longer term.
In its effort to promote economic liquidity, the Fed used the same language as in March. "As previously announced, to provide support to mortgage lending and housing markets and to improve overall conditions in private credit markets, the Federal Reserve will purchase a total of up to $1.25 trillion of agency mortgage-backed securities and up to $200 billion of agency debt by the end of the year. In addition, the Federal Reserve will buy up to $300 billion of Treasury securities by autumn."
For the complete text of the Fed's latest press release please follow this link.
The Haver databases USECON, WEEKLY and DAILY contain the figures from the Federal Reserve Board.
| Current | Last | December | 2008 | 2007 | 2006 | |
|---|---|---|---|---|---|---|
| Federal Funds Rate, % (Target) | 0.00 - 0.25 | 0.00 - 0.25 | 0.16 | 1.93 | 5.02 | 4.96 |
| Discount Rate, % | 0.50 | 0.50 | 0.50 | 2.39 | 5.86 | 5.96 |
by Tom Moeller April 29, 2009
As evidence that the mortgage refinancing boom has lost steam, the Mortgage Bankers Association reported that mortgage applications fell sharply for the second week in the last three. The 18.1% decline last week lowered applications by nearly one-quarter from their early-April peak.
The index of applications to refinance a home mortgage fell by 21.9% just last week and the decline pulled them 25.0% below the peak in early April. Nevertheless, applications for all of this month are still more than double the year-ago level.
Whatever strength there may be in refinancings is hardly
evident in mortgage applications to purchase a home. They had risen
earlier this month but the forward momentum lost steam, falling in each
of the last three weeks. Overall these applications are down by
one-quarter from the year ago level, a decline which is greater than
the y/y decline in new plus existing home sales of 9.3% through March.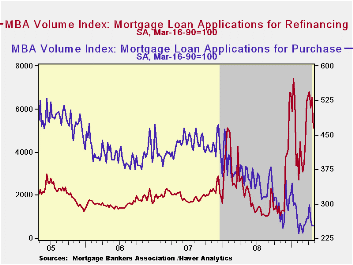
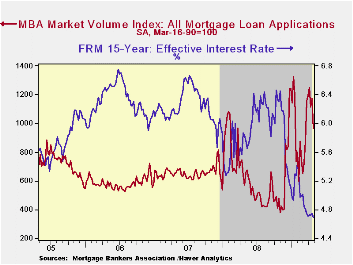
Falling again, the effective interest rate on a conventional 15-year mortgage dropped last week to 4.69%. For a 30-year mortgage, rates also were near their recent lows at 4.85%. Interest rates on 15- and 30-year mortgages are closely correlated (>90%) with the rate on 10-year Treasury securities. For an adjustable 1-Year mortgage the rate has been fairly stable this year near 6.25% but the rate still was down sharply from the 7.07% peak reached this past Fall.
During the last ten years there has been a (negative) 79% correlation between the level of applications for purchase and the effective interest rate on a 30-year mortgage. Moreover, during the last ten years there has been a 61% correlation between the y/y change in purchase applications and the change in new plus existing single family home sales.
The figures for weekly mortgage applications are available in Haver's SURVEYW database.
The Mortgage Bankers Association surveys between 20 to 35 of the top lenders in the U.S. housing industry to derive its refinance, purchase and market indexes. The weekly survey covers roughly 50% of all U.S. residential mortgage applications processed each week by mortgage banks, commercial banks and thrifts. Visit the Mortgage Bankers Association site here.
| MBA Mortgage Applications (3/16/90=100) | 04/24/09 | 04/17/09 | Y/Y | 2008 | 2007 | 2006 |
|---|---|---|---|---|---|---|
| Total Market Index | 960.6 | 1,172.2 | 69.4% | 642.9 | 652.6 | 584.2 |
| Purchase | 251.6 | 253.0 | -26.0% | 345.4 | 424.9 | 406.9 |
| Refinancing | 5,108.2 | 6,540.7 | 168.1% | 2,394.1 | 1,997.9 | 1,634.0 |

Tom Moeller
AuthorMore in Author Profile »Prior to joining Haver Analytics in 2000, Mr. Moeller worked as the Economist at Chancellor Capital Management from 1985 to 1999. There, he developed comprehensive economic forecasts and interpreted economic data for equity and fixed income portfolio managers. Also at Chancellor, Mr. Moeller worked as an equity analyst and was responsible for researching and rating companies in the economically sensitive automobile and housing industries for investment in Chancellor’s equity portfolio. Prior to joining Chancellor, Mr. Moeller was an Economist at Citibank from 1979 to 1984. He also analyzed pricing behavior in the metals industry for the Council on Wage and Price Stability in Washington, D.C. In 1999, Mr. Moeller received the award for most accurate forecast from the Forecasters' Club of New York. From 1990 to 1992 he was President of the New York Association for Business Economists. Mr. Moeller earned an M.B.A. in Finance from Fordham University, where he graduated in 1987. He holds a Bachelor of Arts in Economics from George Washington University.
More Economy in Brief


