Haver Analytics
Haver Analytics
Global| Aug 05 2014

U.S. Gasoline Prices Return to March Low

Summary

The price for a gallon of regular gasoline declined another five cents last week to $3.54 (-2.9% y/y). Prices remained down from the $3.78 per gallon peak reached in February of last year. To account for seasonal volatility, Haver [...]

Chicago Fed National Activity Index Suggests Slower Economic Growth by Tom Moeller  May 22

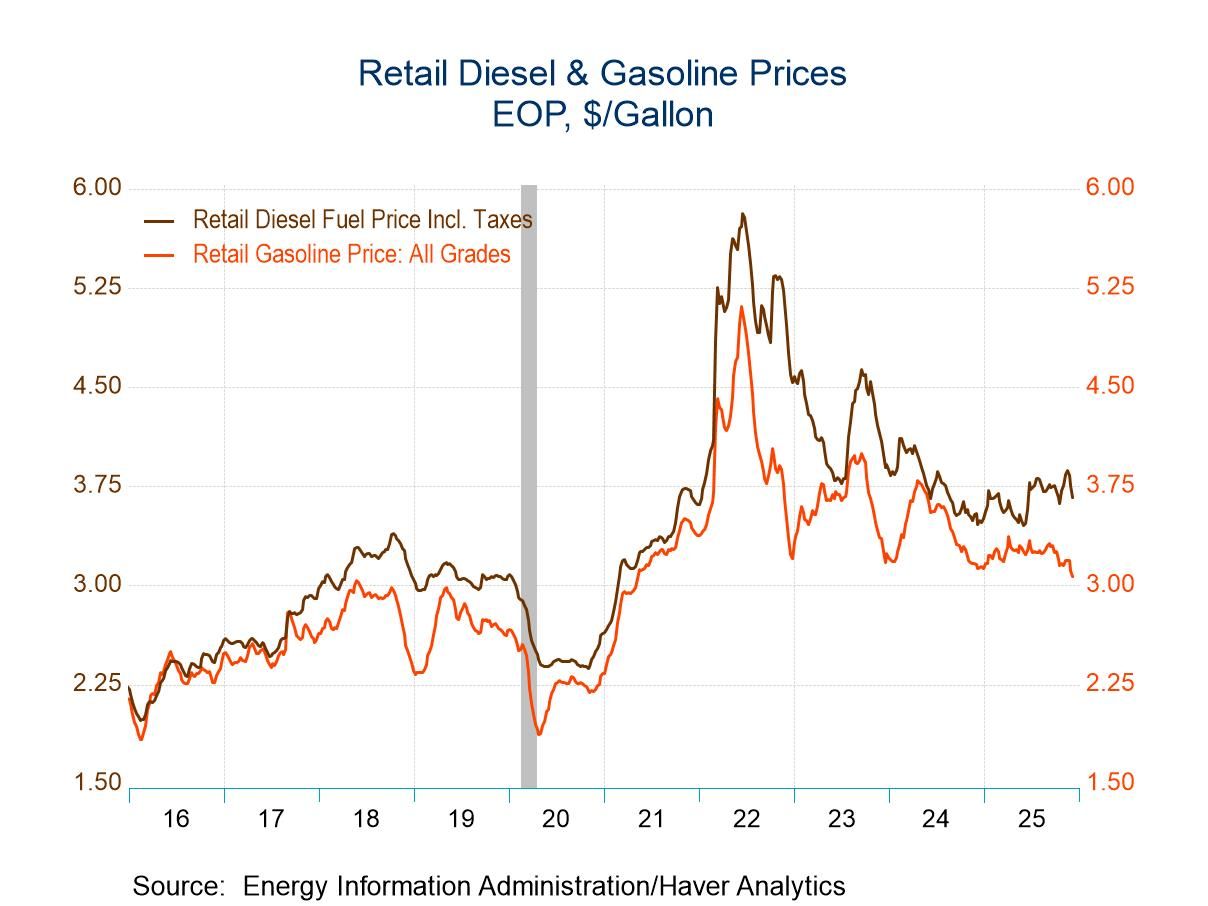
The price for a gallon of regular gasoline declined another five cents last week to $3.54 (-2.9% y/y). Prices remained down from the $3.78 per gallon peak reached in February of last year. To account for seasonal volatility, Haver Analytics constructs factors for adjustment of pump prices. The adjusted cost of gasoline fell six cents to $3.46 per gallon, down for the fourth straight week.

WTI crude oil prices improved last week to $103.44 per barrel (-2.4% y/y). The seasonally adjusted price, generated by Haver, slipped to $101.18 per barrel but remained up sharply from $92.19 in early-May. Yesterday, prices fell back to $101.67. Brent crude oil prices rose last week to $106.40 per barrel (-1.9% y/y) and yesterday were $106.90.

Natural gas prices fell significantly last week to $3.80 per mmbtu (+3.8% y/y), the lowest level since late-November. Prices improved yesterday to $3.82.

The demand for all petroleum products declined 2.0% last week versus last year. Gasoline demand fell 1.0% y/y. Residual fuel oil needs, used for heating, fell 19.9% y/y while distillate demand fell 6.2% y/y. Inventories of crude oil and petroleum products nudged 0.3% higher y/y and gasoline inventories fell 2.2% y/y.

The energy price data are reported by the U.S. Department of Energy and can be found in Haver's WEEKLY database. The daily figures are in DAILY and the petroleum demand and inventory figures are in OILWKLY.

Weekly Energy Prices 08/04/14 07/28/14 07/21/14 Y/Y% 2013 2012 2011
Retail Gasoline ($ per Gallon, Regular) 3.54 3.59 -2.9 3.51 3.62 3.52
Light Sweet Crude Oil, WTI ($ per bbl., WSJ) 103.44 102.37 -2.4 97.95 94.20 95.14
Natural Gas ($/mmbtu, LA, WSJ) 3.80 4.05 3.6 3.73 2.75 3.99
 

U.S. ISM Nonmanufacturing Index Garners Strength
by Tom Moeller  August 5, 2014

Activity in the service & construction sectors increased last month at its quickest rate since August 2005. The Composite Index for the service & building sectors from the Institute for Supply Management (ISM) rose to 58.7 in July from an unrevised 56.0 in June. The latest figure surpassed expectations for 56.5 in the Action Economics Forecast Survey. During the last ten years, there has been a 75% correlation between the level of the nonmanufacturing composite index and the q/q change in real GDP for the service and the construction sectors.

Haver Analytics calculates a composite index using the ISM nonmanufacturing series and the ISM manufacturing sector index released Friday. The July figure improved to 58.5, the highest level since December 2005. During the last ten years, there has been a 76% correlation between this composite index and the quarterly change in real GDP.

The new orders series led the total higher with a 3.7 point increase. Settling at 64.9, the index was at its highest point since August 2005. The business activity series of 62.4 was at its highest level since February 2011. The employment series rose for the third month in the last four to the highest point in six months. During the last ten years, there has been an 89% correlation between the employment index and the m/m change in private service sector plus construction payrolls. The supplier deliveries series nudged up to 51.5, the highest level since March.

The prices paid index slipped to 60.9 and gave back the increases of the last three months. Twenty five percent of respondents paid higher prices while five percent paid less.

Beginning with the January 2008 Nonmanufacturing Report On Business, the composite index is calculated as an indication of overall economic conditions for the nonmanufacturing sector. It is a composite index based on the diffusion indices of four of the indicators (business activity, new orders, employment and supplier deliveries), each with equal weights. Readings above 50 indicate expansion in activity.

The ISM data are available in Haver's USECON database. The expectations figure from Action Economics is in the AS1REPNA database.

ISM Nonmanufacturing Survey (SA) Jul Jun May Jul'13 2013 2012 2011
Composite Diffusion Index 58.7 56.0 56.3 55.9 54.7 54.6 54.4
   Business Activity 62.4 57.5 62.1 59.5 56.7 57.7 57.2
   New Orders 64.9 61.2 60.5 57.7 55.9 56.6 56.3
   Employment 56.0 54.4 52.4 53.9 54.4 53.5 52.4
   Supplier Deliveries (NSA) 51.5 51.0 50.0 52.5 51.7 50.6 51.9
Prices Index 60.9 61.2 61.4 58.3 55.6 59.3 65.1

U.S. Factory Sector Orders and Backlogs Increase
by Tom Moeller  August 5, 2014

New orders to all manufacturers jumped 1.1% (1.5% y/y) in June following a 0.6% decline during May, revised from -0.5%. A 0.6% increase was expected in the Action Economics Forecast Survey. A 1.7% rebound (-0.6% y/y) in durable goods orders led the total higher. Factory sector orders excluding transportation equipment improved 0.8% (4.9% y/y), the third increase in the last four months. Orders for nondurable goods (which equal shipments) recovered 0.6% (3.5% y/y) but have improved just 0.6% since December. Shipments of plastics & rubber rebounded another 1.0% (4.5% y/y). Shipments from chemical plants improved 0.5% but were off 1.2% y/y. Textile mill shipments gained  0.5% (2.9% y/y) while apparel shipments jumped 2.6% (13.3% y/y).

Unfilled orders jumped 1.0% (6.8% y/y), strong for the fourth consecutive month. Excluding the transportation sector, order backlogs rose 1.2% (6.2% y/y). Backlogs of electrical equipment jumped 2.4% (10.3% y/y) and unfilled orders of furniture gained 1.8% (6.1% y/y). Unfilled orders in the machinery sector jumped 1.9% (12.5% y/y) but backlogs of computers & electronics rose just 0.6% (5.2% y/y).

Inventories in the factory sector improved a lessened 0.3% (4.0% y/y) after a 0.8% May rise. In the durable goods sector, inventories rose 0.4% (5.8% y/y) led by a 0.8% increase (4.8% y/y) in primary metals. Transportation sector inventories also gained 0.8% (10.7% y/y). Amongst nondurable goods industries, inventories ticked 0.1% higher (1.4% y/y), held back by a 0.6% decline in basic chemicals (-0.8% y/y). Apparel inventories offset this decline with a 1.9% rise and they're up by one-quarter over the last twelve months.

The factory sector figures are available in Haver's USECON database.

Factory Sector- NAICS Classification Jun May Apr Y/Y 2013 2012 2011
New Orders 1.1 -0.6 0.8 1.5 2.7 2.9 12.9
Shipments 0.5 -0.1 0.4 3.8 2.1 4.0 12.1
Inventories 0.3 0.8 0.5 4.0 2.3 2.4 10.2
Unfilled Orders 1.0 0.7 0.9 6.8 7.0 3.7 10.0
U.S. Energy Prices Remain Weak
by Tom Moeller  August 5, 2014

The price for a gallon of regular gasoline declined two cents last week to $3.52 (-3.2% y/y). Prices remained down from the $3.78 per gallon peak reached in February of last year. To account for seasonal volatility, Haver Analytics constructs factors for adjustment of pump prices. The adjusted cost of gasoline fell five cents to $3.41 per gallon, down for the fifth straight week.

WTI crude oil prices fell further last week to $101.38 per barrel (-2.4% y/y) from $104.35. It was the lowest level since early May.. The seasonally adjusted price, generated by Haver, declined to $100.15 per barrel but remained up sharply from $92.19 in early-May. Yesterday, prices fell further to $98.29. Brent crude oil prices declined last week to $105.73 per barrel (-2.7% y/y) and yesterday were $103.96.

Natural gas prices declined last week to $3.76 per mmbtu (+9.5% y/y), the lowest level since late-November. Prices improved yesterday to $3.82.

The demand for all petroleum products declined 0.9% last week versus last year. Gasoline demand fell 1.0% y/y. Residual fuel oil needs, used for heating, fell by more than one-third y/y while distillate demand fell 3.1% y/y. Inventories of crude oil and petroleum products inched 0.2% higher y/y and gasoline inventories fell 2.3% y/y.

The energy price data are reported by the U.S. Department of Energy and can be found in Haver's WEEKLY database. The daily figures are in DAILY and the petroleum demand and inventory figures are in OILWKLY.

Weekly Energy Prices 08/04/14 07/28/14 07/21/14 Y/Y% 2013 2012 2011
Retail Gasoline ($ per Gallon, Regular) 3.52 3.54 3.59 -3.2 3.51 3.62 3.52
Light Sweet Crude Oil, WTI ($ per bbl., WSJ) 101.38 104.35 102.37 -3.9 97.95 94.20 95.14
Natural Gas ($/mmbtu, LA, WSJ) 3.76 3.80 4.05 9.5 3.73 2.75 3.99
  • Prior to joining Haver Analytics in 2000, Mr. Moeller worked as the Economist at Chancellor Capital Management from 1985 to 1999. There, he developed comprehensive economic forecasts and interpreted economic data for equity and fixed income portfolio managers. Also at Chancellor, Mr. Moeller worked as an equity analyst and was responsible for researching and rating companies in the economically sensitive automobile and housing industries for investment in Chancellor’s equity portfolio.   Prior to joining Chancellor, Mr. Moeller was an Economist at Citibank from 1979 to 1984.   He also analyzed pricing behavior in the metals industry for the Council on Wage and Price Stability in Washington, D.C.   In 1999, Mr. Moeller received the award for most accurate forecast from the Forecasters' Club of New York. From 1990 to 1992 he was President of the New York Association for Business Economists.   Mr. Moeller earned an M.B.A. in Finance from Fordham University, where he graduated in 1987. He holds a Bachelor of Arts in Economics from George Washington University.

    More in Author Profile »

More Economy in Brief