 Global| Feb 10 2009
U.S. Gasoline Prices Highest SinceDecember
by:Tom Moeller
|in:Economy in Brief
Summary
According to the U.S. Department of Energy survey, regular gasoline prices last week continued their upward movement in place since late December. At an average $1.93 per gallon, prices have increased 31 cents from the low. And the [...]
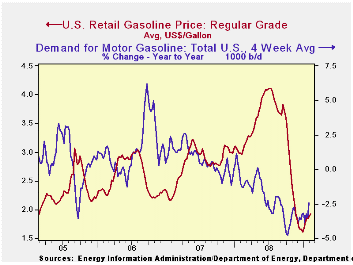
According to the U.S. Department of Energy survey, regular gasoline prices last week continued their upward movement in place since late December. At an average $1.93 per gallon, prices have increased 31 cents from the low. And the up-move continues. Though prices fell slightly yesterday from Friday, the spot market price for regular gasoline at $1.28 per gallon was still higher versus last week's average.
Weekly gasoline prices can be found in Haver's WEEKLY database. Daily prices are in the DAILY database.
Perhaps the shortfall in demand is easing and that is lifting prices. Gasoline demand continued down year-to-year in reaction to the economy's weakness, the U.S. Department of Energy reported. But the year-to-year shortfall eased to -2.4% from its worst comparison of -4.8% last October (the latest four weeks versus the same four weeks in 2008). The decline in the demand for all petroleum products also eased to -2.8% y/y. These numbers are available in Haver's OILWKLY database.
The price for a barrel of West Texas Intermediate crude fell
back last week to $40.50 per barrel from the average $41.72 during
January. Prices reached a high of $145.66 last July. In futures trading
yesterday, the one-month price for crude oil fell versus last week to
$40.08 per barrel, down sharply from one week ago.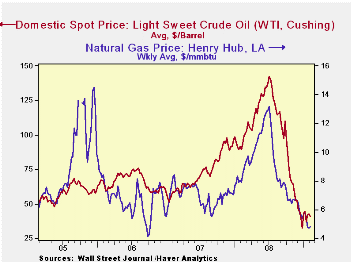
The price of natural gas was roughly stable last week at $4.84 per mmbtu (-38.7% y/y). The latest average price was down roughly two-thirds from the high reached in early-July of $13.19/mmbtu.
The Current Financial Crisis: What Should We Learn from the Great Depressions of the Twentieth Century? from the Federal Reserve Bank of Minneapolis is available here.
| Weekly Prices | 02/09/09 | 02/02/09 | Y/Y | 2008 | 2007 | 2006 |
|---|---|---|---|---|---|---|
| Retail Regular Gasoline ($ per Gallon) | 1.93 | 1.89 | -34.9% | 3.25 | 2.80 | 2.57 |
| Light Sweet Crude Oil, WTI ($ per bbl.) | 40.50 | 42.52 | -54.50% | 100.16 | 72.25 | 66.12 |
U.S. Chain Store Sales Continued Unchanged Last Week
by Tom Moeller February 10, 2009
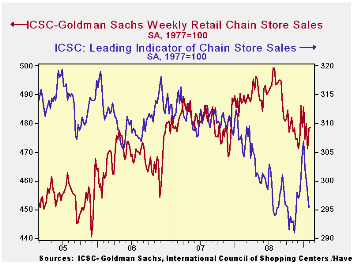
The consumer remained slumbering last week after the holiday season. Chain store sales were roughly stable from the prior week and the latest level also was roughly equal to the January average, according to the International Council of Shopping Centers-Goldman Sachs Index. The year-to year change of -1.8% continued near the weakest in the series' history which extends back to 1990.
During the last ten years there has been a 64% correlation between the year-to-year growth in chain store sales and the growth in general merchandise sales.
The ICSC-Goldman Sachs retail chain-store sales index is constructed using the same-store sales (stores open for one year) reported by 78 stores of seven retailers: Dayton Hudson, Federated, Kmart, May, J.C. Penney, Sears and Wal-Mart.
The outlook for sales continued to worsen as the weekly leading indicator of chain store sales from ICSC-Goldman Sachs fell another 0.8%. It was the fourth straight week of decline.
The chain store sales figures are available in Haver's SURVEYW database.
Global Liquidity and Exchange Rates from the Federal Reserve Bank of New York can be found here.
| ICSC-UBS (SA, 1977=100) | 02/07/09 | 01/31/09 | Y/Y | 2008 | 2007 | 2006 |
|---|---|---|---|---|---|---|
| Total Weekly Chain Store Sales | 478.6 | 478.5 | -1.8% | 1.4% | 2.8% | 3.3% |
U.S. Small Business Optimism Fell Even Further; Pricing At All-time Low
by Tom Moeller February 10, 2009
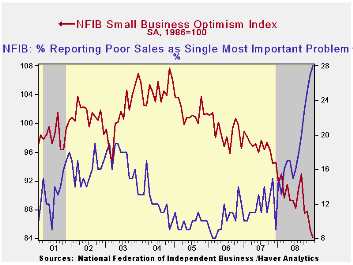
According to the National Federation of Independent Business (NFIB), small business optimism fell again last month. The index level of 84.1 was down 1.3% month-to-month. The latest level was the lowest since early-1980 and was the second lowest level on record.
During the last ten years there has been a 49% correlation between the level of the NFIB index and the two-quarter change in real GDP.
The percentage of firms planning to raise prices fell further to 2%, a new record low. Price discounts were evident as the percentage of firms actually raising prices fell further into negative territory, and the reading was a record low. During the last ten years there has been a 69% correlation between the y/y change in the producer price index and the level of the NFIB price index.
The percentage expecting the economy to improve remained in
negative territory. The percentage reporting that now is a good time to
expand the business fell back to near the lowest since 2003. During the
next 3-6 months, plans for capital spending increased slightly but was
still near the lowest level since 1975.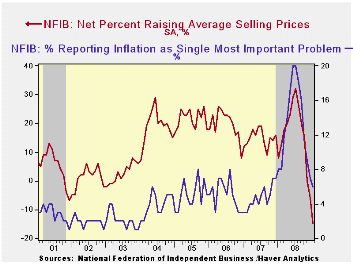
The percentage planning to raise employment remained at last month's low of a net negative 6% while the percentage of respondents with one or more job openings dropped further to 11%, the least since 1992. During the last ten years there has been a 71% correlation between the NFIB employment percentage and the y/y change in nonfarm payrolls.
The percent expecting credit conditions to ease was about unchanged, near its lowest level since 1980. The percent expecting higher real sales in six months fell to a net negative 20%, near the lowest since 1980.
The largest, single most important problems seen by business were poor sales (28%), taxes (19%), government requirements (11%), insurance cost and availability (9%), competition from large businesses (6%) and inflation (6%).
About 24 million businesses exist in the United States. Small business creates 80% of all new jobs in America.
The NFIB figures can be found in Haver's SURVEYS database.
| Nat'l Federation of Independent Business | January | December | Y/Y | 2008 | 2007 | 2006 |
|---|---|---|---|---|---|---|
| Small Business Optimism Index (SA, 1986=100) | 84.1 | 85.2 | -8.4% | 89.8 | 96.7 | 98.9 |
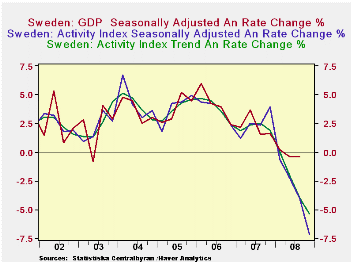
Sweden's Activity Index Points to a 5% + Annual Rate of Decline in Fourth Quarter GDP
by Louise Curley February 10, 2009
Sweden's Activity Index, published today is a monthly
indicator of Gross Domestic Product. It is derived from a regression
based on movements in industrial production, the number of hours worked
by employees in the government sector, sales in retail trade and
imports and exports. (The index is found in the BUSINESS CYCLE
INDICATORS AND SURVEY/FORECASTS section of the NORDIC
database )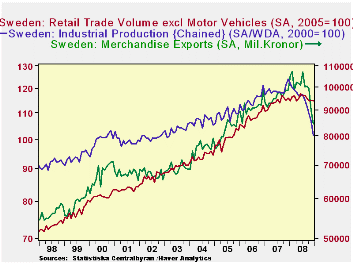
Statistics Sweden computes three indexes: unadjusted, seasonally adjusted and trend. The unadjusted Activity Index is calibrated so that its quarterly values are equal to the seasonally unadjusted GDP values indexed to 2000=100. The annual rates of changes in the seasonally adjusted and trend activity indexes track those in the seasonally adjusted GDP as can be seen in the first chart. These indicators suggest that the gradual annual rates of decline that have been taking place in Sweden's GDP in the last two quarters(-0.39% in the second quarter and -0.38% in the third quarter) are about to be substantially increased. The release of Sweden's fourth quarter GDP is scheduled for February 27, 2009.
Among the larger components of the Activity Index, retail sales have performed better that either exports or industrial production in recent months, although they too have shown a declining trend. It has been Exports and Industrial Production that have largely been responsible for the recent sharp declines in the Activity Index, as can be seen in the second chart.
| SWEDEN | Dec 08 | Nov 08 | Oct 08 | Sep 08 | Aug 08 | July 08 |
|---|---|---|---|---|---|---|
| Activity Index SA (2000=100) | 117.23 | 118.03 | 119.40 | 119.98 | 120.21 | 121.19 |
| Month to Month % Change (SAAR) | -7.81 | -12.98 | -4.68 | -3.49 | -9.29 | 0.11 |
| Activity Index SA (2000=100) | ||||||
| Month to Month % Change (SAAR) | 118.1 | 118.7 | 119.3 | 119.9 | 120.4 | 120.4 |
| Activity Index % Change (SAAR) | 5.40 | 3.98 | 2.11 | 0.00 | 1.93 | 2.55 |
IP Plunges in Main EMU Countries and Beyond
by Robert Brusca February 10, 2009
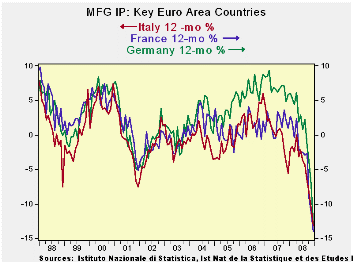
The list of countries reporting steep declines in industrial
output continues. In the quarter-to-date (a full quarter now since we
have December data) the pace of decline is roughly at a 25% annual
rate. And that is steep indeed. Among large economies only Spain saw a
rise in IP in December, but that followed a drop of 9.4% in November.
Spain’s monthly gyrations are extreme. Its Yr/Yr declines are bit more
consistent and consistently weak.
But the BIG NEWS on the day may not have been these weak IP figures as much as the quote attributed to Bundesbank and ECB member Axel Weber who said that the ECB should not be worried about the long term impact of its moves since the economy in Europe was in ‘freefall.’ ‘Freefall’ was apparently the word that Weber himself used. He said the ECB should not worry about ‘lowering rates aggressively.’ This is key statement since last week with weak economic reports all around it, with inflation having fallen more than expected, and with the BOE cutting rates, the ECB chose to standstill. Barely a week later here comes Weber with his guns blazing urging more rapid rate cuts. This is a clear shift for Europe since up to this point there has been a bit more emphasis from the Germans, who tend to be the monetary conservatives, no longer so worried about the stubbornness of inflation. That position had been essentially a reference to the core rate. That concern now seems to have been set aside in favor of concern over the economy itself.
| Main Euro Area Countries and UK IP in MFG | |||||||
|---|---|---|---|---|---|---|---|
| Mo/Mo | 3-Mo | 6-mo | 12-mo | ||||
| MFG Only | Dec-08 | Nov-08 | Oct-08 | Dec-08 | Dec-08 | Dec-08 | Q-to-Date |
| Germany: | -5.3% | -3.8% | -2.1% | -36.5% | -23.8% | -13.1% | -26.9% |
| France: IP excl Construction | -1.8% | -2.8% | -3.8% | -28.8% | -15.1% | -11.1% | -24.1% |
| Italy | -2.7% | -3.2% | -2.2% | -28.1% | -22.8% | -13.1% | -26.0% |
| Spain | 2.7% | -9.4% | -2.0% | -30.9% | -10.1% | -15.0% | -29.8% |
| UK | -2.2% | -3.0% | -1.6% | -24.1% | -16.6% | -10.2% | -19.1% |
| Mo/Mo are simple percent changes others are at Saars | |||||||

Tom Moeller
AuthorMore in Author Profile »Prior to joining Haver Analytics in 2000, Mr. Moeller worked as the Economist at Chancellor Capital Management from 1985 to 1999. There, he developed comprehensive economic forecasts and interpreted economic data for equity and fixed income portfolio managers. Also at Chancellor, Mr. Moeller worked as an equity analyst and was responsible for researching and rating companies in the economically sensitive automobile and housing industries for investment in Chancellor’s equity portfolio. Prior to joining Chancellor, Mr. Moeller was an Economist at Citibank from 1979 to 1984. He also analyzed pricing behavior in the metals industry for the Council on Wage and Price Stability in Washington, D.C. In 1999, Mr. Moeller received the award for most accurate forecast from the Forecasters' Club of New York. From 1990 to 1992 he was President of the New York Association for Business Economists. Mr. Moeller earned an M.B.A. in Finance from Fordham University, where he graduated in 1987. He holds a Bachelor of Arts in Economics from George Washington University.
More Economy in Brief


