 Global| Mar 10 2008
U.S. Flow of Funds: Debt Growth Slowed, Household Net Worth Down
by:Tom Moeller
|in:Economy in Brief
Summary
Credit market debt outstanding owed by all sectors of the economy grew 8.6% AR (8.9% y/y) during the fourth quarter of 2007. The gain was a marked slowdown from the strong 10.9% rise during 3Q. Boosted by the growing budget deficit, [...]
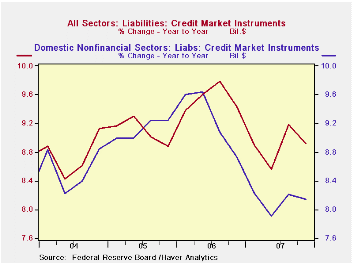
Credit market debt outstanding owed by all sectors of the economy grew 8.6% AR (8.9% y/y) during the fourth quarter of 2007. The gain was a marked slowdown from the strong 10.9% rise during 3Q.
Boosted by the growing budget deficit, the federal government's debt obligations grew 4.9% last year which was up from the 3.9% gain during 2006. Nevertheless, the y/y rise of 4.9% was about half the peak 10.9% rise during 2003.
Consumer credit debt growth slowed to a 5.7% quarterly rate of
growth (6.8% y/y) from 7.0% during 3Q. For the year, the 6.8% rate of
increase was nearly half the peak rate of 2003 and reflected the
slowdown in consumer spending. Households' obligations on home
mortgages grew just 5.0% (6.6% y/y) which again was half the gain four
years earlier as home purchases tumbled. Conversely, credit card debt
growth during the year sped up slightly to 5.5% from 3.9% during 2006.
Bank loans nearly doubled during the year.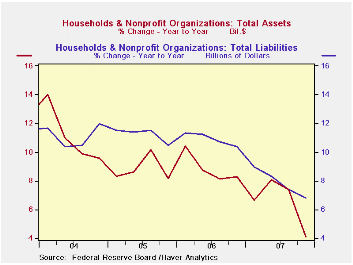
Credit market debt owed by the nonfinancial corporate business sector also sped up to a 11.1% y/y rate of growth which was the strongest in ten years. The non corporate business sector also generated a slight speedup in debt accumulation to a 12.9% rate.
Credit market debt owed by the financial sector accelerated as
well to an 11.1% rate of growth which was the strongest gain since
2001. Liabilities at commercial banks grew 26.0% y/y, savings
institutions by 34.6% and credit unions by nearly three quarters. 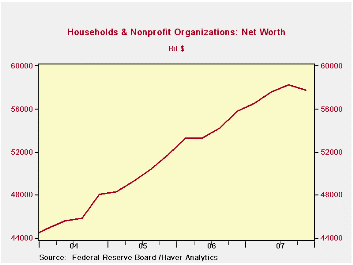
The net worth of the U.S. household sector last quarter deteriorated during 4Q to $57.2 trillion from the prior quarter's record level. The dollar level of household sector assets fell $307.6 billion pulled down by a $54.0 billion loss in tangible asset values (+2.8% y/y) and a $253.6 billion drop in financial values (+4.9% y/y). Liabilities grew $255.2 billion (6.8% y/y).
Assessing Employment Growth in 2007 from the Federal Reserve Bank of San Francisco can be found here.
Recent Trends in Economic Volatility: Conference Summary also from the Federal Reserve Bank of San Francisco is available here
| Flow of Funds (Y/Y % Chg.) | % of Total | 4Q '07 | 3Q'07 | 2007 | 2006 | 2005 |
|---|---|---|---|---|---|---|
| Total Credit Market Debt Outstanding | -- | 8.9 | 9.2 | 8.9 | 9.4 | 8.9 |
| Federal Government | 11% | 4.9 | 4.3 | 4.9 | 3.9 | 7.0 |
| Households | 28% | 6.8 | 7.3 | 6.8 | 10.2 | 11.1 |
| Nonfinancial Corporate Business | 13% | 11.1 | 10.8 | 11.1 | 8.0 | 4.8 |
| Nonfarm, NonCorporate Business | 7% | 12.9 | 12.4 | 12.9 | 12.5 | 13.6 |
| Financial Sectors | 32% | 11.1 | 11.4 | 11.1 | 10.0 | 8.5 |
| Net Worth: Households & Nonprofit Organizations (Trillions) | -- | $57.718 | $58.251 | $57.718 | $55.800 | $51.580 |
| Tangible Assets: Households | -- | $26.760 | $26.813 | $26.760 | $26.037 | $24.427 |
| Financial Assets: Households | -- | $45.333 | $45.587 | $45.333 | $43.218 | $39.544 |
by Louise Curley March 10, 2008
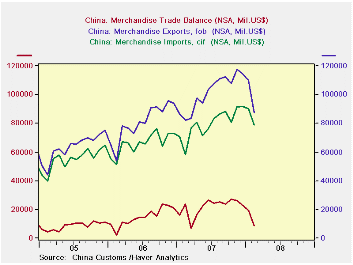
China's balance on trade in goods declined substantially in
February to $8.6 billion from $19.5 billion in January. Both exports
and imports declined; the former by 20% and the latter by 13%. The
unadjusted figures are shown in the first chart. Part of the declines
in exports and imports may have resulted from the extreme weather
conditions which disrupted transportation. In addition, the variable
occurrence of the Chinese New Year always introduces anomalies in
Chinese statistics at the beginning of the year.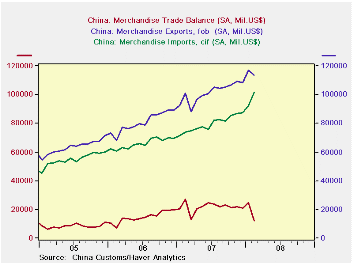
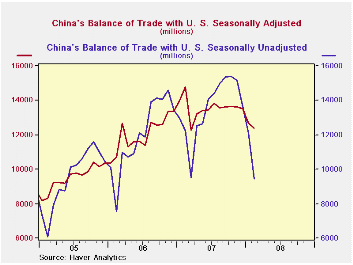
Haver Analytics adjusts the data for seasonal factors and the occurrence of the Chinese New Year. These adjusted data are shown in the second chart. Even with seasonal adjustment, the decline in the balance of trade remains significant. The seasonally adjusted exports show a decline, the seasonally adjusted imports show a substantial rise.
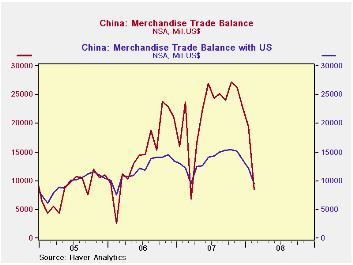
While the total trade balance shows a decline of over 50% for both the seasonally adjusted and the non adjusted data for February, the balance of trade with the U. S. showed a smaller decline of about 20% for the seasonally adjusted and unadjusted. On a seasonally adjusted basis Chinese exports to the U.S. were still positive. The third chart compares the Chinese balance of trade with the U.S. on a seasonally adjusted and an unadjusted basis. Finally the fourth chart compares the total Chinese surplus on trade with the surplus on trade with the U. S.
| CHINA TRADE DATA (Mil. US%) | Feb 08 | Jan 08 | Feb 07 | M/M %Chg | Y/Y %Chg | 2006 | 2005 | 2004 |
|---|---|---|---|---|---|---|---|---|
| Total Exports (NSA) | 87368 | 109655 | 82020 | -20.32 | 6.52 | 1218020 | 968935 | 461953 |
| Imports (NSA) | 78813 | 90174 | 58336 | -12.60 | 35.02 | 955821 | 791461 | 659953 |
| Balance (NSA) | 8555 | 19480 | 23694 | -56.07 | 63.89 | 262200 | 177474 | 102000 |
| Exports (SA) | 113616 | 116995 | 101012 | -289 | 12.48 | 1218020 | 968935 | 461953 |
| Imports (SA) | 101525 | 92259 | 73790 | 10.05 | 37.59 | 955821 | 791461 | 659953 |
| Balance (SA) | 12091 | 24741 | 27222 | -51.03 | -55.58 | 262200 | 177474 | 102000 |
| Exports to US Domestic (NSA) | 15478 | 19162 | 16336 | -19.22 | -5.25 | 232761 | 203512 | 162937 |
| Imports from US (NSA) | 6053 | 7068 | 4095 | -14.36 | 47.81 | 69861 | 59223 | 48735 |
| Balance (NSA) | 9425 | 12094 | 12241 | -22.07 | -23.06 | 162900 | 144289 | 114202 |
| Exports to US Domestic (SA) | 20599 | 19780 | 19888 | 4.14 | 3.58 | 232761 | 203512 | 162937 |
| Imports from US (SA) | 8185 | 7085 | 5113 | 15.55 | 60.09 | 69861 | 59223 | 48735 |
| Balance (SA) | 12414 | 15695 | 14776 | -20.90 | -15.99 | 162900 | 144289 | 114202 |
by Robert Brusca March 10, 2008
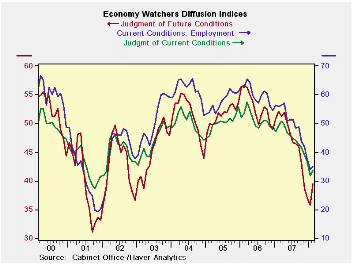
Japan’s economy watcher’s index made a long awaited bounce in February. The future conditions index rebounded most sharply. The current conditions and current employment indices each made soft rebounds as well. The future index is now ‘only in the bottom 17th percentile of its five year range instead of at the bottom. The overall economy watchers index is only up to the bottom 7.1% of its range from the bottom. Typically when the future index has been weak and makes a significant rebound that rebound is meaningful. The rise in the various economy watcher indices this month is encouraging.
| Japan Economy Watchers Surveys | |||||||
|---|---|---|---|---|---|---|---|
| Raw readings of each survey | Percent of 5Yr range* | ||||||
| Feb-08 | Jan-08 | Dec-07 | Nov-07 | Feb-08 | Jan-08 | Dec-07 | |
| Diffusion | |||||||
| Economy Watchers | 33.6 | 31.8 | 36.6 | 38.8 | 7.1% | 0.0% | 5.0% |
| Employment | 35.0 | 34.1 | 37.5 | 41.9 | 2.8% | 0.0% | 0.0% |
| Future | 39.5 | 35.8 | 37.0 | 38.8 | 17.8% | 0.0% | 1.5% |
by Robert Brusca March 10, 2008
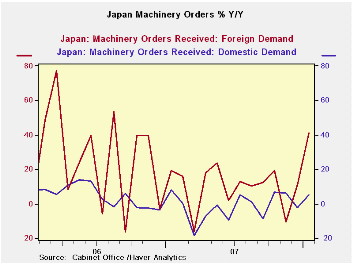
Japan orders are showing signs of erratic rebound. Orders hit their cycle low early in 2007. Since then they have been rebounding irregularly. Foreign demand is showing the sharpest increase but the domestic/foreign order breakdowns are for total orders not core orders explaining why the two series are so volatile.
The table below shows that the core orders with the lesser volatility are now in a clear trend and are recovering strongly over the recent 3 months. The progression from two years ago forward shows steady improvement in order growth rates.
| Japan Machinery Orders | |||||||
|---|---|---|---|---|---|---|---|
| m/m % | Saar % | ||||||
| SA | Jan-08 | Dec-07 | Nov-07 | 3-Mos | 6-Mos | 12-Mos | 12-Mo Ago |
| Total | 26.5% | -6.8% | -5.9% | 51.3% | 45.1% | 18.9% | 11.4% |
| Core Orders* | 19.6% | -3.2% | -2.8% | 60.1% | 17.0% | 11.4% | 2.6% |
| Total Orders | |||||||
| Foreign Demand | 43.1% | -4.9% | -18.4% | 51.8% | 113.2% | 41.1% | 19.5% |
| Domestic demand | 15.5% | -8.3% | 3.5% | 44.6% | 13.3% | 5.0% | 8.0% |
| * Excl ships and electric power | |||||||

Tom Moeller
AuthorMore in Author Profile »Prior to joining Haver Analytics in 2000, Mr. Moeller worked as the Economist at Chancellor Capital Management from 1985 to 1999. There, he developed comprehensive economic forecasts and interpreted economic data for equity and fixed income portfolio managers. Also at Chancellor, Mr. Moeller worked as an equity analyst and was responsible for researching and rating companies in the economically sensitive automobile and housing industries for investment in Chancellor’s equity portfolio. Prior to joining Chancellor, Mr. Moeller was an Economist at Citibank from 1979 to 1984. He also analyzed pricing behavior in the metals industry for the Council on Wage and Price Stability in Washington, D.C. In 1999, Mr. Moeller received the award for most accurate forecast from the Forecasters' Club of New York. From 1990 to 1992 he was President of the New York Association for Business Economists. Mr. Moeller earned an M.B.A. in Finance from Fordham University, where he graduated in 1987. He holds a Bachelor of Arts in Economics from George Washington University.
More Economy in Brief


