 Global| Apr 14 2009
U.S. Finished Goods PPI Falls Unexpectedly While Core Prices Remain Stable
by:Tom Moeller
|in:Economy in Brief
Summary
U.S. producer prices for finished goods fell last month for the first time this year. The 1.2% decrease followed the 0.1% February uptick and it contrasted with Consensus expectations for no change in last month's index level. The [...]
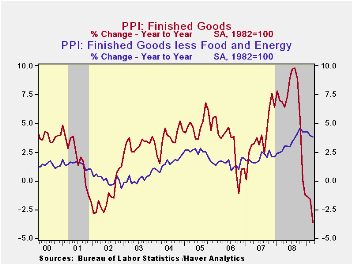
U.S. producer prices for finished goods fell last month for the first time this year. The 1.2% decrease followed the 0.1% February uptick and it contrasted with Consensus expectations for no change in last month's index level. The decline was led by finished energy prices which fell for the first time in three months. They posted a 12.1% (-25.5% y/y) drop. Finished gasoline prices fell 13.1% which was the first since December (-50.7% y/y) while home heating oil prices fell another 13.2% (-57.0% y/y). Natural gas prices dropped 2.4% (-8.2% y/y).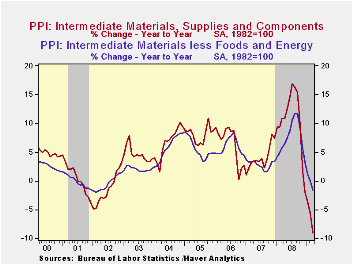
Prices of core finished consumer goods rose just 0.1% (4.1% y/y) after the strong 0.4% February rise. Durable consumer goods prices were unchanged for the weakest reading since November (+3.0% y/y) while core nondurable goods prices increased another 0.3% (5.1% y/y). Finally, capital equipment prices fell for the first time since the end of 2007. A drop of 0.2% shaved its year-to-year gain to 3.4%, down from its high of 4.3% last October.
Prices for finished foods continued lower with a 0.7% decline (-1.0% y/y). The drop was led by lower meat (-11.1% y/y) and dairy product costs (-15.1% y/y).
Falling again were prices for intermediate goods which should foreshadow even lower finished goods prices. Intermediate goods prices nearly doubled their February decline with a 1.5% drop and the 9.0% y/y shortfall was a record. Excluding food & energy, prices also remained weak as they posted a 0.3% drop, their sixth monthly decline. The 1.6% y/y decline remained the weakest change in prices since early 2002.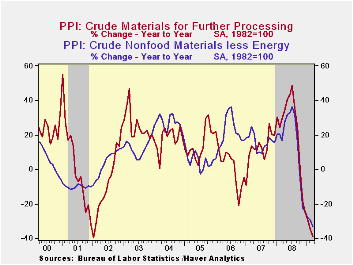
The crude materials PPI dipped again as economic growth continued negative. Down 0.3%, the overall drop reflected a 1.6% decline in core pricing which pulled prices down by one-third from the year ago level. Copper prices are down by more than half from last year as are steel scrap and aluminum prices.
The Producer Price Index data is available in Haver's USECON database. More detailed data is in the PPI and in the PPIR databases.
Rethinking the Implications of Monetary Policy: How a Transactions Role for Money Transforms the Predictions of Our Leading Models from the Federal Reserve Bank of Philadelphia can be found here.
| Producer Price Index (%) | March | February | Y/Y | 2008 | 2007 | 2006 |
|---|---|---|---|---|---|---|
| Finished Goods | -1.2 | 0.1 | -3.6 | 6.4 | 3.9 | 2.9 |
| Core | 0.0 | 0.2 | 3.8 | 3.4 | 2.0 | 1.5 |
| Intermediate Goods | -1.5 | -0.9 | -9.0 | 10.5 | 4.0 | 6.4 |
| Core | -0.3 | -0.6 | -1.6 | 7.6 | 2.8 | 6.0 |
| Crude Goods | -0.3 | -4.5 | -38.9 | 21.2 | 11.9 | 1.4 |
| Core | -1.6 | 1.5 | -33.1 | 15.0 | 15.6 | 20.8 |

Tom Moeller
AuthorMore in Author Profile »Prior to joining Haver Analytics in 2000, Mr. Moeller worked as the Economist at Chancellor Capital Management from 1985 to 1999. There, he developed comprehensive economic forecasts and interpreted economic data for equity and fixed income portfolio managers. Also at Chancellor, Mr. Moeller worked as an equity analyst and was responsible for researching and rating companies in the economically sensitive automobile and housing industries for investment in Chancellor’s equity portfolio. Prior to joining Chancellor, Mr. Moeller was an Economist at Citibank from 1979 to 1984. He also analyzed pricing behavior in the metals industry for the Council on Wage and Price Stability in Washington, D.C. In 1999, Mr. Moeller received the award for most accurate forecast from the Forecasters' Club of New York. From 1990 to 1992 he was President of the New York Association for Business Economists. Mr. Moeller earned an M.B.A. in Finance from Fordham University, where he graduated in 1987. He holds a Bachelor of Arts in Economics from George Washington University.
More Economy in Brief


