 Global| Oct 16 2009
U.S. Factory Production Climbs For Third Month While Plant Utilization Reaches Seven-Month High
by:Tom Moeller
|in:Economy in Brief
Summary
Industrial production is hardly overheating, but the nation's industrial plant is starting to hum again. Output rose a surprising 0.7% during September after gains of 1.2% and 0.8% during the prior two months. An uptick of a meager [...]
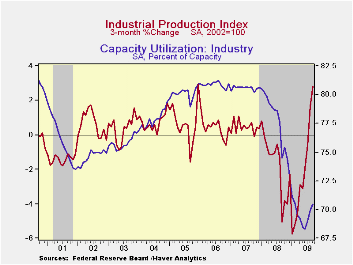
Industrial production is hardly overheating, but the nation's
industrial plant is starting to hum again. Output rose a surprising
0.7% during September after gains of 1.2% and 0.8% during the prior two
months. An uptick of a meager 0.1% had been the Consensus expectation,
based on the decline in factory sector employment last month. 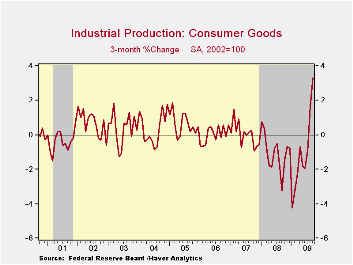 The
productivity of those still working thus soared. The recent output
recovery follows a decline of 14.5% during the 21 months of recession
beginning in January of 2008.
The
productivity of those still working thus soared. The recent output
recovery follows a decline of 14.5% during the 21 months of recession
beginning in January of 2008.
Output of consumer goods rose a firm 1.1% for the third month
of increase following a 10.1% drop during the recession. Production of
autos led the increase with a 7.3% rise, after two months of decline
and a recession loss of 38.5%. Furniture & appliance output
rose a lesser 0.3% which was the second in the last three months.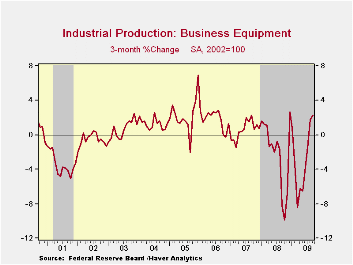 Working the other way, the output of computers, video & audio
equipment showed no sign of recovery, posting a 1.4% (-16.5% y/y)
decline. Outside of the auto and high-tech sectors output ticked 0.3%
higher (-5.3% y/y) during September for the third consecutive monthly
gain. That's against the 12.8% decline during the prior 21 months.
Working the other way, the output of computers, video & audio
equipment showed no sign of recovery, posting a 1.4% (-16.5% y/y)
decline. Outside of the auto and high-tech sectors output ticked 0.3%
higher (-5.3% y/y) during September for the third consecutive monthly
gain. That's against the 12.8% decline during the prior 21 months.
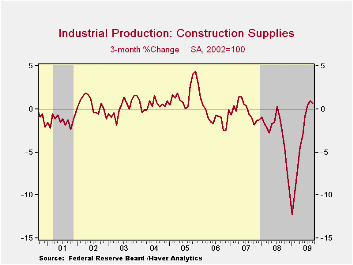
Apparel output rose for third consecutive month of strong gain and the 2.2% increase cut the y/y decline to 11.4%. The output of business equipment rose 0.2% (-8.0% y/y) but the output of construction supplies continued 0.4% (-16.8% y/y) lower after four months of relative stability. Construction supplies output fell 23.4% during this recession.
 Excess industrial capacity diminished during September for the
third consecutive month. In the factory sector alone, the rise to 67.5%
also was the third consecutive monthly gain but it nevertheless left
the figure near its lowest of the postwar period. Across industries,
utilization remained the smallest since WWII.
Excess industrial capacity diminished during September for the
third consecutive month. In the factory sector alone, the rise to 67.5%
also was the third consecutive monthly gain but it nevertheless left
the figure near its lowest of the postwar period. Across industries,
utilization remained the smallest since WWII.
The industrial production data are available in Haver's USECON database.
| INDUSTRIAL PRODUCTION (SA, %) | September | August | Y/Y | 2008 | 2007 | 2006 |
|---|---|---|---|---|---|---|
| Total Output | 0.7 | 1.2 | -6.0 | -2.2 | 1.5 | 2.3 |
| Manufacturing | 0.8 | 1.2 | -7.8 | -3.2 | 1.4 | 2.5 |
| Consumer Goods | 1.1 | 1.5 | -1.8 | -2.6 | 0.9 | 0.4 |
| Business Equipment | 0.2 | 1.1 | -8.0 | -1.1 | 2.7 | 9.4 |
| Construction Supplies | -0.4 | 0.5 | -16.8 | -6.3 | -2.0 | 2.3 |
| Utilities | -0.7 | 1.9 | -2.1 | 0.3 | 3.4 | -0.6 |
| Capacity Utilization | 70.5 | 69.9 | 74.5 (Sept. '08) | 77.5 | 80.6 | 80.9 |

Tom Moeller
AuthorMore in Author Profile »Prior to joining Haver Analytics in 2000, Mr. Moeller worked as the Economist at Chancellor Capital Management from 1985 to 1999. There, he developed comprehensive economic forecasts and interpreted economic data for equity and fixed income portfolio managers. Also at Chancellor, Mr. Moeller worked as an equity analyst and was responsible for researching and rating companies in the economically sensitive automobile and housing industries for investment in Chancellor’s equity portfolio. Prior to joining Chancellor, Mr. Moeller was an Economist at Citibank from 1979 to 1984. He also analyzed pricing behavior in the metals industry for the Council on Wage and Price Stability in Washington, D.C. In 1999, Mr. Moeller received the award for most accurate forecast from the Forecasters' Club of New York. From 1990 to 1992 he was President of the New York Association for Business Economists. Mr. Moeller earned an M.B.A. in Finance from Fordham University, where he graduated in 1987. He holds a Bachelor of Arts in Economics from George Washington University.
More Economy in Brief


