 Global| Apr 02 2008
U.S. Factory Inventory Rise Continued Firm
by:Tom Moeller
|in:Economy in Brief
Summary
Factory inventories rose 0.5% in February, down from the 1.3% surge during January. Despite the lesser rate of monthly gain, the three month growth in inventories jumped to 11.3% (AR) which was near its strongest since early 2005. [...]
Factory inventories rose 0.5% in February, down from the 1.3% surge during January. Despite the lesser rate of monthly gain, the three month growth in inventories jumped to 11.3% (AR) which was near its strongest since early 2005.
Strength within the transportation sector accounts for some of
that lift. The aircraft industry is having an outsized effect and
inventories there rose 1.4% in February following a 3.7% January surge,
and three month growth is at 39.2% (AR). But still showing strength
were inventories excluding the transportation sector. They rose 0.4% in
February and three month growth rose to 9.5% after no gain early last
year. Inventories of machinery, computers & electronics and
electrical equipment & appliances are growing more rapidly. 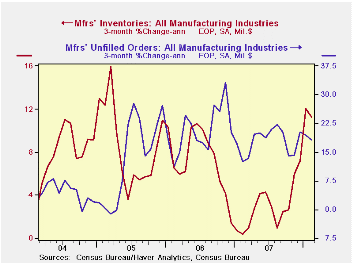
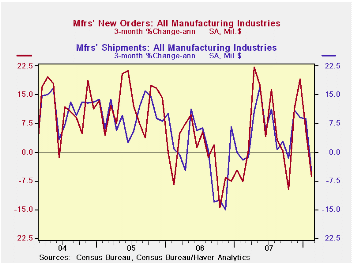
With a 2.1% decline, factory shipments took back all of January's 1.1% jump. Excluding the transportation sector the numbers were as bleak and shipments fell 1.8% after just a 0.8% January increase.Three month growth turned to a negative 4.8% which was the weakest since late 2006. It reflected declines in textiles, apparel, computers and furniture.
Total factory orders fell another 1.3% during February. Less the transportation sector altogether orders fell a larger 1.8%. Durable orders overall fell 1.1% and that was slightly less than the 1.7% decline reported in the advance report. Nevertheless, the three month rate of change fell to -0.4% and less transportation the three month change in orders was a negative 6.4%. Nondurable orders (which equal shipments) fell at a 7.4% rate.
Overall unfilled orders rose 0.9% in February and the three month rate of increase continued very strong at 18.2%. Shipments of civilian aircraft & parts couldn't keep pace with orders, so unfilled orders rose. Excluding the transportation sector altogether unfilled orders fell 0.1% m/m and the three month average growth rate fell to a still firm 8.4% (AR).
| Factory Survey (NAICS, %) | February | January | Y/Y | 2007 | 2006 | 2005 |
|---|---|---|---|---|---|---|
| Inventories | 0.5 | 1.3 | 5.5 | 3.7 | 6.4 | 8.9 |
| Excluding Transportation | 0.4 | 1.3 | 4.5 | 2.5 | 7.1 | 8.0 |
| New Orders | -1.3 | -2.3 | 6.0 | 1.4 | 5.1 | 11.6 |
| Excluding Transportation | -1.8 | -0.3 | 6.1 | 1.2 | 5.4 | 11.5 |
| Shipments | -2.1 | 1.1 | 5.5 | 1.1 | 4.3 | 10.3 |
| Excluding Transportation | -1.8 | 0.8 | 6.5 | 1.3 | 5.0 | 11.4 |
| Unfilled Orders | 0.9 | 0.8 | 18.6 | 18.1 | 20.0 | 15.0 |
| Excluding Transportation | -0.1 | 0.8 | 8.5 | 9.1 | 14.1 | 8.4 |
by Tom Moeller April 2, 2008
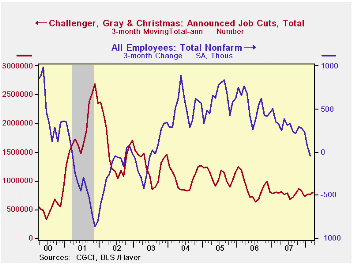
Job cut announcements in March fell to 53,579 from 72,091 during the prior month, according to the Challenger, Grey & Christmas survey. The three month average of announcements, however, has been stable since early last year.
The three month average of job cut announcements is up sharply in the aerospace, services, government, industrial goods, pharmaceutical, retail and transportation industries but has been stable most elsewhere.
During the last ten years there has been a 76% (inverse) correlation between the three month moving average of announced job cuts and the three month change payroll employment.
Job cut announcements differ from layoffs. Many are achieved through attrition, early retirement or just never occur.
Challenger also reported that announced hiring plans were down slightly m/m but that the three month average was little changed.
Maps and data that illustrate subprime and alt-A mortgage loan conditions across the United States, from the Federal Reserve, can be found here.
| Challenger, Gray & Christmas | March | February | Y/Y | 2007 | 2006 | 2005 |
|---|---|---|---|---|---|---|
| Announced Job Cuts | 53,579 | 72,091 | 9.4% | 768,264 | 839,822 | 1,072,054 |
by Tom Moeller April 2, 2008
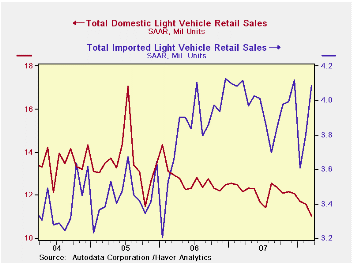
U.S. sales of light vehicles during March at a 15.11M unit annual selling rate were at the lowest level since October 2005 according to the Autodata Corporation. The 1.7% m/m decline from 15.38M followed an increase of just 0.3% during February and a 5.4% January plunge.
Sales of domestically made light vehicles fell
4.7% m/m. Sales of U.S. made cars fell 1.7%, the same as during
February but higher gasoline prices contributed to a 7.0% decline in
sales of domestically made light trucks. They're now at the lowest
level in ten years.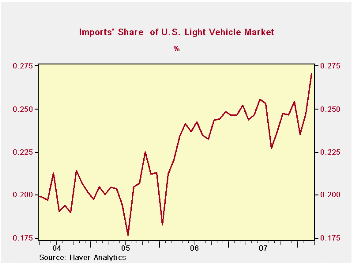
Sales of imported light vehicles rose another 7.4% m/m to 4.09M units after a 5.4% February increase. The latest was near the record level. Sales of imported autos surged 11.5% following February's 6.9% m/m advance. Sales of imported light trucks ticked up 0.5% m/m after a 2.9% February gain.
Import's share of the U.S. light vehicle
market rose to a record 27.0%. Imported vehicles are those produced
outside the U.S. and does not include vehicles with the nameplate of a
foreign manufacturer produced within the U.S.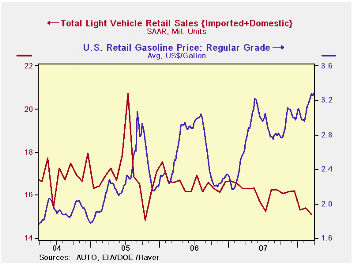
Retail gasoline prices last week again moved up another three cents to $3.29 per gallon, according to the US Department of Energy survey.Pushing the price up was an increase in the price for spot WTI crude oil prices to $104.23 per barrel.
Today's testimony by Fed Chairman Ben S. Bernanke on the Economic Outlook can be found here.
| Light Vehicle Sales (SAAR, Mil. Units) | March | February | Y/Y | 2007 | 2006 | 2005 |
|---|---|---|---|---|---|---|
| Total | 15.11 | 15.38 | -7.2% | 16.18 | 16.55 | 16.96 |
| Autos | 7.51 | 7.31 | -0.8% | 7.58 | 7.77 | 7.65 |
| Domestic | 4.84 | 4.92 | -2.7% | 5.07 | 5.31 | 5.40 |
| Imported | 2.67 | 2.39 | 2.9% | 2.51 | 2.45 | 2.25 |
| Light Trucks | 7.61 | 8.06 | -12.8% | 8.60 | 8.78 | 9.32 |
| Domestic | 6.19 | 6.65 | -14.1% | 7.12 | 7.42 | 8.12 |
| Imported | 1.42 | 1.41 | -6.6% | 1.48 | 1.37 | 1.20 |
| Weekly Prices | 03/31/08 | 03/24/08 | Y/Y | 2007 | 2006 | 2005 |
|---|---|---|---|---|---|---|
| Retail Gasoline ($ per Gallon) | 3.29 | 3.26 | 21.5% | 2.80 | 2.57 | 2.27 |
| Light Sweet Crude Oil, WTI ($ per bbl.) | 104.23 | 106.02 | 61.9% | 94.00 | 61.11 | 58.16 |
by Tom Moeller April 2, 2008
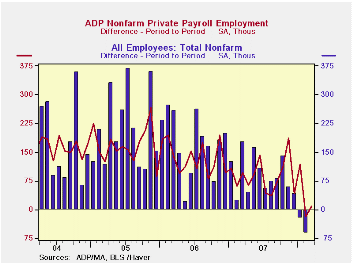
The ADP National Employment Report, from the payroll processor, reported that private nonfarm payrolls rose 8,000 last month after a slightly revised decline of 18,000 during February.
The U.S. Bureau of Labor Statistics employment figure for February will be published Friday.Last month, the 18,000 decline in ADP's measure of private nonfarm payrolls was accompanied by a 101,000 worker decline in private sector payrolls as reported by BLS.
According to ADP and Macro Advisers, the correlation between the monthly percentage change in the ADP estimate and that in the BLS data is 0.90.
The ADP sub-index for large payrolls fell 52,000 (-0.8% y/y) after a 32,000 worker decline during February.
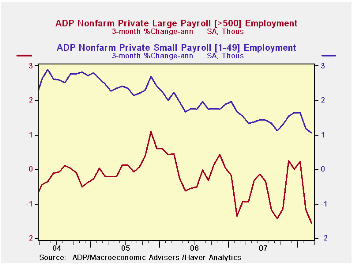
A 55,000 worker increase (1.3% y/y) in small sized payrolls during March offset that decline and followed a 16,000 worker increase the prior month.
Growth in medium sized payrolls of 5,000 (0.8% y/y) followed a 2,000 worker February decline.
Employment in the goods producing industries fell 77,000 (-2.0% y/y) and services payrolls rose 85,000 (1.4% y/y).
ADP compiled the estimate from its database of individual companies' payroll information. Macroeconomic Advisers, LLC, the St. Louis economic consulting firm, developed the methodology for transforming the raw data into an economic indicator.
The ADP National Employment Report data is maintained in Haver's USECON database; historical data go back to December 2000. The figures in this report cover only private sector jobs and exclude employment in the public sector, which rose an average 11,083 during the last twelve months.
The full ADP National Employment Report can be found here, and the ADP methodology is explained here.
| LAXEPA@USECON | March | February | Y/Y | 2007 | 2006 | 2005 |
|---|---|---|---|---|---|---|
| Nonfarm Private Payroll Employment (m/m Chg.) | 8,000 | -18,000 | 0.8% | 1.1% | 1.7% | 1.8% |
by Robert Brusca April 2, 2008
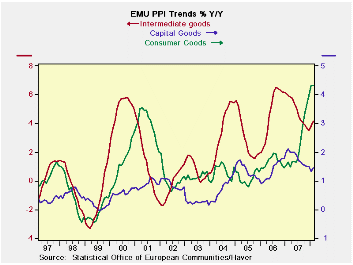
PPI trends are decidedly poor in the Euro Area. The core PPI excluding energy is on the rise with its three-month pace at 5.1% up from 3.9% over six months and from 3.6% over 12 months. This sort of acceleration in the ex-energy rate is going to be disquieting. This sort of pressure is the reason that the ECB remains vigilant on inflation and that a German Banker group, the German Bankers Association (BDB), registered concerns today about strong inflation pressures and elevated wage deals. The BDB is concerned about a wage-price spiral. ECB rhetoric is usually couched in terms of avoiding ‘second round effects’ and anchoring inflation expectations.
However you express these concerns, the PPI embodies the risk that the ECB and the German bankers fear.
So far, however, it is the PPI that is bad off and the HICP that is relatively better behaved. HICP inflation rates are more subdued. But there will be concerns that this PPI inflation pressure and this ex-energy trend can be passed on. Germany, France, Italy and the UK (and EU country) each embodies the trend of an accelerating ex-energy price spurt. That by itself is troubling. At 3.6% the yr/yr rate for PPI inflation in the EMU is already ahead of the allowable ceiling (2%) for the HICP. Italy’s 12-mo ex-energy PPI pace is 5.7%, France’s is 3.1%, and Germany’s is 2.7%. This is a lot of congestion above the ceiling rate for the HICP.
The February PPI is not a welcome report in the Euro Area, nor will the BOE like it..
| Euro Area and UK PPI Trends | ||||||
|---|---|---|---|---|---|---|
| M/M | Saar | |||||
| Euro Area 15 | Feb-08 | Jan-08 | 3-Mo | 6-MO | Yr/Yr | Y/Y Yr Ago |
| Total ex Construction | 0.6% | 0.9% | 6.6% | 7.4% | 5.3% | 2.9% |
| Excl Energy | 0.5% | 0.7% | 5.1% | 3.9% | 3.6% | 3.5% |
| Capital Goods | 0.3% | 0.4% | 3.0% | 2.0% | 1.5% | 2.1% |
| Consumer Goods | 0.3% | 0.6% | 5.0% | 5.2% | 4.3% | 1.6% |
| Intermediate &Capital Goods | 0.6% | 0.7% | 5.2% | 3.2% | 3.1% | 4.4% |
| Energy | 1.1% | 1.6% | 12.0% | 19.9% | 11.7% | 1.0% |
| MFG | 0.6% | 0.5% | 4.7% | 5.8% | 5.3% | 2.5% |
| Germany | 0.7% | 0.8% | 6.1% | 6.0% | 3.8% | 2.8% |
| Ex Energy | 0.5% | 0.4% | 4.0% | 2.7% | 2.7% | 3.0% |
| France | 0.4% | 0.6% | 4.6% | 6.1% | 4.9% | 2.2% |
| Ex Energy | 0.3% | 0.5% | 4.0% | 3.3% | 3.1% | 2.9% |
| Italy | 0.7% | 0.6% | 5.9% | 7.4% | 5.7% | 4.0% |
| Ex Energy | 0.5% | 0.7% | 4.8% | 3.6% | 3.4% | 4.2% |
| UK | 0.1% | 1.5% | 11.8% | 19.2% | 8.3% | -1.0% |
| Ex Energy | 0.3% | 1.1% | 6.8% | 5.2% | 3.9% | 3.5% |
| Euro Area Harmonized PPI excluding Construction. | ||||||
| The EA 15 countries are Austria, Belgium, Cyprus, Finland, France, Germany, Greece, Ireland, Italy, Luxembourg, Malta, the Netherlands, Portugal, Slovenia and Spain. | ||||||

Tom Moeller
AuthorMore in Author Profile »Prior to joining Haver Analytics in 2000, Mr. Moeller worked as the Economist at Chancellor Capital Management from 1985 to 1999. There, he developed comprehensive economic forecasts and interpreted economic data for equity and fixed income portfolio managers. Also at Chancellor, Mr. Moeller worked as an equity analyst and was responsible for researching and rating companies in the economically sensitive automobile and housing industries for investment in Chancellor’s equity portfolio. Prior to joining Chancellor, Mr. Moeller was an Economist at Citibank from 1979 to 1984. He also analyzed pricing behavior in the metals industry for the Council on Wage and Price Stability in Washington, D.C. In 1999, Mr. Moeller received the award for most accurate forecast from the Forecasters' Club of New York. From 1990 to 1992 he was President of the New York Association for Business Economists. Mr. Moeller earned an M.B.A. in Finance from Fordham University, where he graduated in 1987. He holds a Bachelor of Arts in Economics from George Washington University.
More Economy in Brief


