 Global| Aug 05 2009
U.S. Factory Inventory Decumulation Eases Somewhat
by:Tom Moeller
|in:Economy in Brief
Summary
An easing rate of inventory decumulation is now playing a part in improving the level of factory sector output. During June, factory sector inventories fell 0.8%, the same as they did in May and that compares with 1.0%+ declines [...]
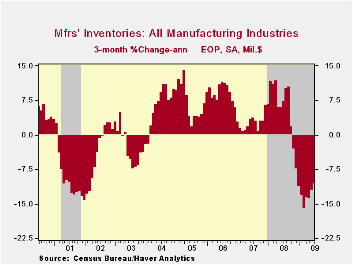
An easing rate of inventory decumulation is now playing a part in improving the level of factory sector output. During June, factory sector inventories fell 0.8%, the same as they did in May and that compares with 1.0%+ declines extending back to December. During the last three months the 10.5% annualized rate of inventory decumulation was down from 15.9% this past Winter. Much of that deceleration is due, however, to lower oil prices. Excluding oil, factory inventories fell at a 12.4% three-month rate that was just a slight moderation from earlier.
In fact, moderation in inventory decumulation rates is fairly
spotty amongst various industries. Showing very modest accumulation
were inventories of transportation equipment after declining at a
three-month rate of 9.3% as recently as March. In addition, inventories
of electrical equipment & appliances have fallen at a slightly
reduced 19.3% rate and machinery inventories fell at a somewhat reduced
14.8% rate. Conversely, steep production cuts lowered furniture
inventories at a 28.6% rate which near its quickest. Inventories of
primary metals also fell at a fairly stable 32.4% pace and computer
inventory decumulation accelerated to a 15.1% rate during the last
three months. 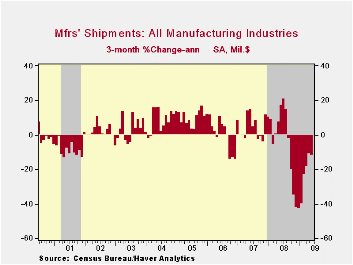
The reason for the modest improvement in inventory destocking has been an improved shipment picture. Factory shipments actually rose 1.4% during June and that was the first monthly increase in nearly one year. Increases in the transportation area and in the machinery industries accounted for much of the gain. Most elsewhere the rates of decline in shipments moderated substantially.
Finally, new orders have improved. The 0.4% June increase was the fourth in the last five months. It reflected a sharp monthly rise both in primary metals (-46.5% y/y) and machinery (-26.0% y/y) orders as well as a slight increase in electrical equipment (-30.8% y/y) orders. Bookings of transportation equipment and furniture continued to fall.
The Manufacturers' Shipments, Inventories and Orders (MSIO) data is available in Haver's USECON database.
The international dimension of productivity and demand shocks in the U.S. economy from the Federal Reserve Bank of San Francisco can be found here.
| Factory Survey (NAICS, %) | June | May | Y/Y | 2008 | 2007 | 2006 |
|---|---|---|---|---|---|---|
| Inventories | -0.8 | -0.8 | -8.5 | 2.1 | 3.7 | 8.2 |
| Excluding Transportation | -1.0 | -0.9 | -11.4 | -0.6 | 2.7 | 7.9 |
| New Orders | 0.4 | 11.1 | -24.1 | 0.1 | 1.9 | 6.2 |
| Excluding Transportation | 2.3 | 0.9 | -22.6 | 3.1 | 1.2 | 7.4 |
| Shipments | 1.4 | -0.8 | -21.4 | 1.7 | 1.2 | 5.9 |
| Excluding Transportation | 1.4 | -0.0 | -21.6 | 3.7 | 1.5 | 6.7 |
| Unfilled Orders | -0.9 | -0.3 | -9.5 | 3.5 | 17.1 | 15.3 |
| Excluding Transportation | -0.1 | -0.7 | -14.0 | -1.0 | 8.2 | 16.0 |
by Tom Moeller August 5, 2009
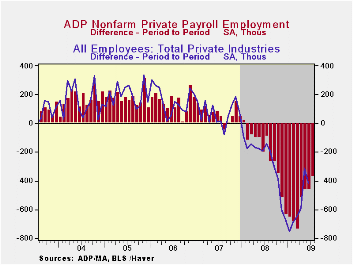
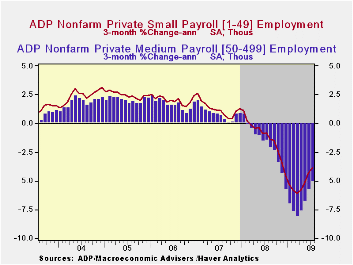
Deterioration in the U.S. labor market continued last month, just not at the same rate as it had. The latest report from the payroll processor ADP, in their National Employment Report, indicated that private nonfarm payrolls fell 371,000 during July after a revised 463,000 June decline that was slightly shallower than reported initially. The latest reading was the eighteenth consecutive monthly decline, but the monthly change was the smallest since October of last year and roughly half the worst this past March. The three-month annualized rate of decline in payrolls also eased to 4.6% from its March peak of 7.1%.
ADP compiled the estimate from its database of individual companies' payroll information. Macroeconomic Advisers, LLC, the St. Louis economic consulting firm, developed the methodology for transforming the raw data into an economic indicator.
The U.S. Bureau of Labor Statistics will report July payroll employment this Friday. For comparison, June's 463,000 worker decline in ADP's measure of private nonfarm payrolls was accompanied by 415,000 job losses in the BLS measure of private sector payrolls. According to ADP and Macro-Advisers, the correlation between the monthly percentage change in the ADP estimate and that in the BLS data is 0.90.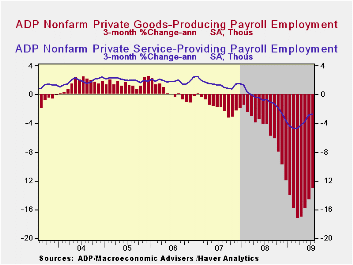 ADP reported that medium-sized payrolls remained in forefront
of July job loss. They fell another 159,000 (-5.8% y/y) followed by a
138,000 (-4.4% y/y) worker decline in small-sized payrolls. Large
payrolls fell by 74,000 (-5.7% y/y). In a switch from the prior
pattern, the steady decline in service producing industry employment
outpaced that in the goods sector. The 202,000 (-3.3% y/y) drop was the
sixteenth consecutive monthly decline and in percentage terms roughly
equaled the prior three months. These recent declines are, however,
roughly half the worst from December through March. Medium-sized
service payrolls fell 86,000 (-3.7% y/y) and small-sized payrolls
dropped 80,000 (-2.9% y/y). Large service producing payrolls dropped by
36,000 (-3.5% y/y).
ADP reported that medium-sized payrolls remained in forefront
of July job loss. They fell another 159,000 (-5.8% y/y) followed by a
138,000 (-4.4% y/y) worker decline in small-sized payrolls. Large
payrolls fell by 74,000 (-5.7% y/y). In a switch from the prior
pattern, the steady decline in service producing industry employment
outpaced that in the goods sector. The 202,000 (-3.3% y/y) drop was the
sixteenth consecutive monthly decline and in percentage terms roughly
equaled the prior three months. These recent declines are, however,
roughly half the worst from December through March. Medium-sized
service payrolls fell 86,000 (-3.7% y/y) and small-sized payrolls
dropped 80,000 (-2.9% y/y). Large service producing payrolls dropped by
36,000 (-3.5% y/y).
 In the goods producing sector there were 169,000 fewer jobs in
July (-13.1% y/y). Here, the three-month rate of change eased to a
still hefty -13.1% from -17.1% at its worst. Details show that
medium-sized payrolls fell 73,000 (-13.7% y/y) followed by a 58,000
(-12.5% y/y) shortfall in small-sized payrolls. Large payrolls fell
38,000 (-13.1% y/y). In the manufacturing sector alone, payrolls fell
99,000 (-12.8% y/y).
In the goods producing sector there were 169,000 fewer jobs in
July (-13.1% y/y). Here, the three-month rate of change eased to a
still hefty -13.1% from -17.1% at its worst. Details show that
medium-sized payrolls fell 73,000 (-13.7% y/y) followed by a 58,000
(-12.5% y/y) shortfall in small-sized payrolls. Large payrolls fell
38,000 (-13.1% y/y). In the manufacturing sector alone, payrolls fell
99,000 (-12.8% y/y).
The ADP National Employment Report data is maintained in Haver's
USECON database; historical figures date back to December 2000. The figures in this report cover only private sector jobs and exclude employment in the public sector, which rose an average 11,083 during the last twelve months.| LAXEPA@USECON | July | June | Y/Y | 2008 | 2007 | 2006 |
|---|---|---|---|---|---|---|
| Total Nonfarm Private Payroll Employment (m/m Chg., 000s) | -371 | -463 | -5.2% | -0.5% | 1.2% | 2.0% |
| Small Payroll (1-49) | -138 | -169 | -4.4 | -0.0 | 1.6 | 2.2 |
| Medium Payroll (50-499) | -159 | -203 | -5.8 | -0.5 | 1.2 | 1.9 |
| Large Payroll (>500) | -74 | -91 | -5.7 | -1.6 | -0.1 | 0.4 |
by Tom Moeller August 5, 2009
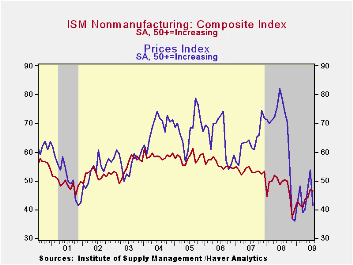
The recent sharp improvement in service sector activity stalled last month, but not by much. The Composite Index for the nonmanufacturing sector from the Institute for Supply Management (ISM) slipped to 46.4 from an unrevised reading of 47.0 during June. Though below the break-even level of 50, the latest figure still was near the highest level since September of last year. It fell short of Consensus expectations for a reading of 48.0. A level of the ISM index below 50 indicates declining activity. Since the series' inception in 1997 there has been a 60% correlation between the level of the business activity index in the nonmanufacturing sector and the Q/Q change in real GDP for the services and the construction sectors.
ISM surveys more than 370 purchasing managers in more than 62 industries including law firms, hospitals, government and retailers. The nonmanufacturing survey dates back to July 1997.
The July decline in the overall index was broad-based amongst
the component series. The employment index slipped to 41.5 but that
still was near the highest level since October. Thirteen percent of
firms reported higher employment levels while 26% reported lower
levels. Since the series' inception in 1997 there has been a 56%
correlation between the level of the ISM nonmanufacturing employment
index and the m/m change in payroll employment in the service-producing
plus the construction industries.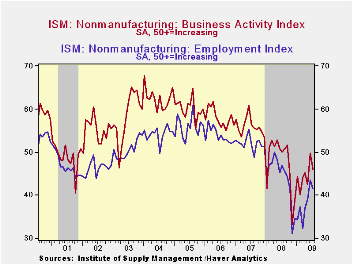
The overall business activity index for the service sector also fell to 46.1, but remained near its highest level since September. And slipping just slightly to 48.1 was the new orders series, though it remained well above last November's low of 35.6. Perhaps suggesting that the level of slack in the service sector has diminished, the supplier delivery index rose to the highest level since January.
The decline in service sector activity brought with it an easing of price pressure. The sharp 12.4 point m/m decline in the price index to 41.3 returned it to the lowest level since April. It was the sharpest one-month decline since last November. A much reduced 13% of firms reported higher prices while a significantly increased 28% reported lower prices. Since its inception ten years ago, there has been a 60% correlation between the price index and the q/q change in the GDP services chain price index.
Beginning with the January 2008 Nonmanufacturing Report On Business®, the composite index is calculated as an indicator of the overall economic condition for the non-manufacturing sector. It is a composite index based on the diffusion indices of four of the indicators (business activity, new orders, employment and supplier deliveries) with equal weights. The latest report from the ISM can be found here.
| ISM Nonmanufacturing Survey | July | June | July '08 | 2008 | 2007 | 2006 |
|---|---|---|---|---|---|---|
| Composite Index | 46.4 | 47.0 | 49.6 | 47.4 | 53.5 | 55.7 |
| Business Activity | 46.1 | 49.8 | 50.1 | 47.4 | 56.0 | 58.0 |
| Employment | 41.5 | 43.4 | 46.8 | 43.8 | 52.0 | 53.8 |
| Prices Index | 41.3 | 53.7 | 78.8 | 66.0 | 63.8 | 65.3 |
by Tom Moeller August 5, 2009
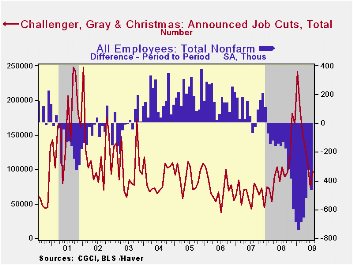
The outplacement firm of Challenger, Grey & Christmas indicated that job cut announcements picked up last month. They rose to 97,373 versus the 74,373 jobs lost during June. Nevertheless, the figures remain well below this cycle's peak level of layoffs which occurred this past January when there were 241,749 cuts. Challenger also reported that announced hiring plans remained near the cycle low.
Announcement of job cuts in the chemical, energy, telecommunications, transportation and financial sectors remained strong. Shallower declines elsewhere were broad-based including the auto, consumer goods, computer, electronics, government, retail and services.
During the last ten years there has been a 67% (inverse) correlation between the three month moving average of announced job cuts and the three month change payroll employment. Job cut announcements differ from layoffs. Many are achieved through attrition, early retirement or just never occur.
The Challenger figures are available in Haver's SURVEYS database.
| Challenger, Gray & Christmas | July | June | Y/Y | 2008 | 2007 | 2006 |
|---|---|---|---|---|---|---|
| Announced Job Cuts | 97,373 | 74,373 | -9.0% | 1,223,993 | 768,264 | 839,822 |
by Robert Brusca August 5, 2009
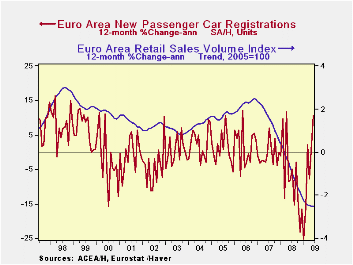
Sales fall -Retail sales fell in the Zone
in June. While the growth rat of sales is not decaying further, retail
sales volumes have been dropping at a pace of -2.5% to -2.2% over the
past twelve months. The year-over-year pace for retail sales seems to
have finally stopped falling, based on the trend in the chart above.
The Good and Ugly of it all - Europe has
not suffered the same sort of spurt in the rate of unemployment that we
have in the US. But its level of unemployment remains high and it has
become even more elevated than it was. Consumer confidence has been hit
and consumers, even though better supported in Europe than in the US by
government programs, have cut back spending. Various programs in Europe
to spur auto sales have been successful as the auto registration data
show. So even as retail sales volumes shrink there is a bright spot in
the retail sector even if it is one aided by government actions. It is
always good to see that when given an incentive the consumer can and
does respond – that is not always the case.
Underlying trends are improving - The PMI
index from Markit on the service sector shows some improvement in the
service sector but not much. Services has improved to a reading of
44.82 in may then they slipped to 44.65 in June and in July they have
risen to 45.69. German showed a rather sharp rise in July along with
Italy while France has back-slipped in July along with Spain. The UK,
an EU member not an EMU member, has just posted its third reading in a
row above 50 for services and is the only large EU country showing
service sector expansion.
Trends that matter are more favorable -
Since most of the jobs are in services and since jobs determine
spending we can be encouraged about prospects for retail sales progress
from these developments. Retail sales remain the back bone of GDP
growth.
| Euro Area Retail Sales Volume | ||||||
|---|---|---|---|---|---|---|
| M/M | Saar | |||||
| Jun-09 | May-09 | Apr-09 | 3-Mo | 6-MO | 12-Mo | |
| Euro Area Total | -0.2% | -0.2% | -0.2% | -2.2% | -2.5% | -2.5% |
| Food, Beverages, Tobacco | -0.1% | -0.1% | -0.2% | -1.8% | -2.1% | -2.1% |
| Registrations: | ||||||
| Motor Vehicle Registration | 6.4% | 2.3% | 6.3% | 79.6% | 45.1% | 10.6% |
| Non-Food Country Detail: Volume | ||||||
| Germany | -1.8% | -1.3% | 1.4% | -6.9% | -5.5% | -1.9% |
| UK(EU) | 1.2% | -1.0% | 0.8% | 4.0% | 1.3% | 2.8% |
| The EA 13 countries are Austria, Belgium, Finland, France, Germany, Greece, Ireland, Italy, Luxembourg, the Netherlands, Portugal, Slovenia | ||||||

Tom Moeller
AuthorMore in Author Profile »Prior to joining Haver Analytics in 2000, Mr. Moeller worked as the Economist at Chancellor Capital Management from 1985 to 1999. There, he developed comprehensive economic forecasts and interpreted economic data for equity and fixed income portfolio managers. Also at Chancellor, Mr. Moeller worked as an equity analyst and was responsible for researching and rating companies in the economically sensitive automobile and housing industries for investment in Chancellor’s equity portfolio. Prior to joining Chancellor, Mr. Moeller was an Economist at Citibank from 1979 to 1984. He also analyzed pricing behavior in the metals industry for the Council on Wage and Price Stability in Washington, D.C. In 1999, Mr. Moeller received the award for most accurate forecast from the Forecasters' Club of New York. From 1990 to 1992 he was President of the New York Association for Business Economists. Mr. Moeller earned an M.B.A. in Finance from Fordham University, where he graduated in 1987. He holds a Bachelor of Arts in Economics from George Washington University.
More Economy in Brief


