 Global| Nov 24 2008
U.S. Existing Home Sales Slide Along Bottom, Prices Down 20%
by:Tom Moeller
|in:Economy in Brief
Summary
During October, U.S. existing home sales reversed most of the prior month's rise and fell 3.1% to 4.980 million, according to the National Association of Realtors. The 3.1% decline followed a revised 4.7% September increase and it was [...]
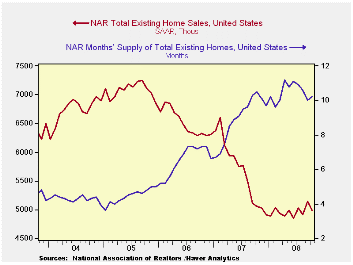
During October, U.S. existing home sales reversed most of the prior month's rise and fell 3.1% to 4.980 million, according to the National Association of Realtors. The 3.1% decline followed a revised 4.7% September increase and it was slightly greater than Consensus expectations for which were for a selling rate of 5.00M homes. Total sales include sales of condos and co-ops.
The month-to-month volatility in home sales this year has been near a roughly stable trend line at the 5.0 million unit level, down 11.8% from last year's average.
Median home prices fell 4.2% (NSA) during October for the fourth consecutive monthly drop. That pulled the y/y comparison to -11.3%. Prices have fallen 20.0% since their peak in June 2007.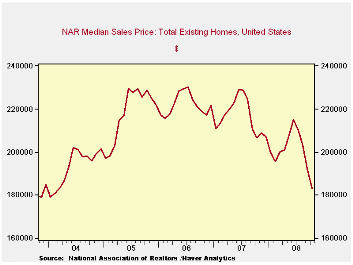
By region, home sales in the Midwest led last month's decline with a 6.0% drop and they were down nearly ten percent from last year. In the South sales fell 2.2% m/m (-10.2% y/y). In the West sales slipped 1.6%, however, they were up one-third from last October. Sales in the Northeast fell 1.2% and they were off 17.7% from last year's average.
The number of unsold homes (condos & single-family) on the market fell for the third straight month (-4.5% y/y). Nevertheless, at the current sales rate there as a 10.2 months' supply on the market. That was down from the April peak of 11.2 months. For single-family homes the inventory ticked up m/m to a 9.6 months supply at the current sales rate, down from an 11.0 months supply in June.
The House testimony offered by Fed GovernorRandall S. Kroszner titled the Effects of the financial crisis on small business is available here.
| Existing Home Sales (Thous) | October | y/y % | September | October '07 | 2007 | 2006 | 2005 |
|---|---|---|---|---|---|---|---|
| Total | 4,980 | -1.6 | 5,140 | 5,020 | 5,672 | 6,508 | 7,076 |
| Northeast | 830 | -9.8 | 840 | 910 | 1,008 | 1,090 | 1,168 |
| Midwest | 1,100 | -9.1 | 1,170 | 1,220 | 1,331 | 1,491 | 1,589 |
| South | 1,840 | -10.2 | 1,900 | 2,050 | 2,240 | 2,576 | 2,704 |
| West | 1,210 | 37.5 | 1,230 | 880 | 1,093 | 1,353 | 1,617 |
| Single-Family | 4,430 | 0.0 | 4,580 | 4,430 | 4,958 | 5,703 | 6,181 |
| Median Price, Total, $ | 183,300 | -11.3 | 191,400 | 206,700 | 216,617 | 222,000 | 218,217 |

Tom Moeller
AuthorMore in Author Profile »Prior to joining Haver Analytics in 2000, Mr. Moeller worked as the Economist at Chancellor Capital Management from 1985 to 1999. There, he developed comprehensive economic forecasts and interpreted economic data for equity and fixed income portfolio managers. Also at Chancellor, Mr. Moeller worked as an equity analyst and was responsible for researching and rating companies in the economically sensitive automobile and housing industries for investment in Chancellor’s equity portfolio. Prior to joining Chancellor, Mr. Moeller was an Economist at Citibank from 1979 to 1984. He also analyzed pricing behavior in the metals industry for the Council on Wage and Price Stability in Washington, D.C. In 1999, Mr. Moeller received the award for most accurate forecast from the Forecasters' Club of New York. From 1990 to 1992 he was President of the New York Association for Business Economists. Mr. Moeller earned an M.B.A. in Finance from Fordham University, where he graduated in 1987. He holds a Bachelor of Arts in Economics from George Washington University.
More Economy in Brief


