 Global| Jan 26 2009
U.S. Existing Home Sales Rose Last Month
by:Tom Moeller
|in:Economy in Brief
Summary
Could the decline in home sales be stabilizing, perhaps due to lower prices? According to the National Association of Realtors, sales of existing homes rose 6.5% last month to 4.740M. The 9.4% November decline was slightly deeper than [...]
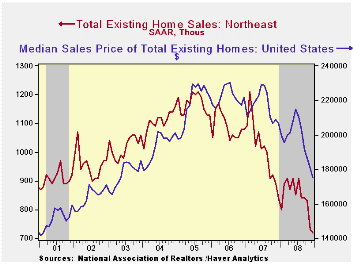
Could the decline in home sales be stabilizing, perhaps due to lower prices? According to the National Association of Realtors, sales of existing homes rose 6.5% last month to 4.740M. The 9.4% November decline was slightly deeper than reported initially. Consensus expectations had been for sales of 4.40M homes. Total sales include sales of condos and co-ops.
Median home prices fell yet again during December. The 2.7% (NSA) decline followed a 3.3% November drop that was slightly deeper than initially reported. It was the sixth consecutive monthly drop and it lowered prices by 15.3% from December of 2007. Prices have fallen 23.4% since their peak in June 2007.
The number of unsold homes (condos & single-family) on the market dropped a sharp 11.7% (-7.5% y/y). At the current sales rate there was a 9.3 months' supply on the market which was the lowest since early during 2007. For single-family homes the inventory fell m/m to an 8.7 months supply at the current sales rate which also was the lowest since 2007.
Last month, sales of existing single-family homes recovered
nearly all of the November decline with a 7.0% increase. Nevertheless,
sales of existing homes remained down by nearly one-third from their
peak in mid-2005.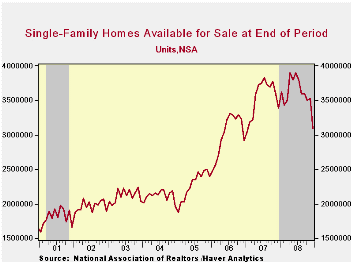
By region, home sales in the West posted the strongest gain in December with a 13.6% rise. This gain recouped all of the declines during the prior two months and returned sales to the upward trend line that has been in place since the low in October of 2007. Sales in the South also gained 7.4% versus November but that level was the series' low for this cycle. Sales in the Midwest also rose by 4.0%. That too was off the series' low. Sales in the Northeast fell 1.4% after a huge 12.0% November drop. Single family home sales here were at their lowest since 1992.
| Existing Home Sales (Thous) | December | y/y % | November | December '07 | 2008 | 2007 | 2006 |
|---|---|---|---|---|---|---|---|
| Total | 4,740 | -3.5 | 4,450 | 4,910 | 4,897 | 5,672 | 6,508 |
| Northeast | 720 | -14.3 | 730 | 840 | 842 | 1,008 | 1,090 |
| Midwest | 1,040 | -10.3 | 1,000 | 1,160 | 1,129 | 1,331 | 1,491 |
| South | 1,740 | -11.2 | 1,620 | 1,960 | 1,863 | 2,240 | 2,576 |
| West | 1,250 | 31.6 | 1,100 | 950 | 1,066 | 1,093 | 1,353 |
| Single-Family | 4,260 | -1.4 | 3,980 | 4,320 | 4,345 | 4,958 | 5,703 |
| Median Price, Total, $ | 175,400 | -15.3 | 180,300 | 207,000 | 197,217 | 216,617 | 222,000 |
by Tom Moeller January 26, 2009
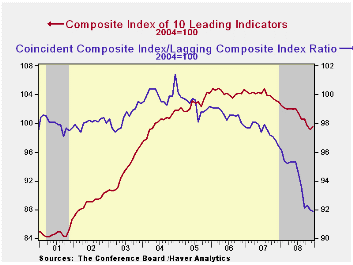
The Conference Board reported that the December composite index of leading economic indicators rose 0.3% after an unrevised 0.4% November decline. The peak for the index was in July of last year and the six-month percent change of -5.0% was near the largest rate of decline since 1990.
Five of the ten components of the leading index fell last month with the largest declines coming from lower building permits, shorter hours worked and easier vendor performance. Higher initial claims for jobless insurance also subtracted a sharp 0.15 percentage points from the leaders and consumer expectations were about unchanged. Faster money supply growth added back one percentage point to the m/m change in the leading index and a steeper yield curve added another 0.2 points.
The breadth of one-month increase amongst the leaders' 10
components improved to 50% but over a six-month period the breadth of
gain amongst the components remained stuck at a quite low 30%.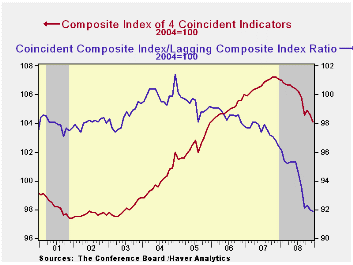
The leading index is based on actual reports for eight economic data series. The Conference Board initially estimates two series, orders for consumer goods and orders for capital goods.
The coincident indicators fell again. The 0.5% decline followed an unrevised 0.3% November drop an it was the tenth of the year. Three quarters of the index components fell m/m but over six months 25.0% rose. Year-to-year the coincident indicators fell 2.8% and over the last ten years there has been a 76% correlation between this y/y change and real GDP.
The lagging index fell 0.4% after no change in November. The ratio of coincident-to-lagging indicators (a measure of economic excess) fell slightly to its lowest level since 1975.
Visit the Conference Board's site for coverage of leading indicator series from around the world.
| Business Cycle Indicators (%) | December | November | October | Sept. 6-Month % (AR) | 2008 | 2007 | 2006 |
|---|---|---|---|---|---|---|---|
| Leading | 0.3 | -0.4 | -1.0 | -5.0 | -2.7 | -0.3 | 1.5 |
| Coincident | -0.5 | -0.3 | 0.3 | -2.8 | -0.8 | 1.6 | 2.5 |
| Lagging | -0.4 | 0.0 | 0.1 | 2.9 | 2.8 | 2.8 | 3.3 |
by Tom Moeller January 26, 2009
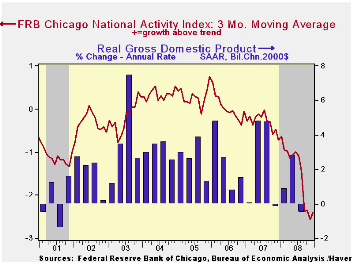
For December, the National Activity Index (CFNAI) from the Chicago Federal Reserve Bank continued lower into recession territory. The latest reading of -3.26 was near it's historic low. Since 1970 there has been a 75% correlation between the level of the index and the q/q change in real GDP.
The three-month moving average of the index of -2.40 was at its lowest level since January of 1982.
An index level at or below -0.70 typically has indicated negative U.S. economic growth. A zero value of the CFNAI indicates that the economy is expanding at its historical trend rate of growth of roughly 3%.
The complete CFNAI report is available here and the historical data are available in Haver's SURVEYS database.
Each category of the index including employment, production, income, consumption & housing made a negative contribution to the November index.
The CFNAI is a weighted average of 85 indicators of economic activity. The indicators reflect activity in the following categories: production & income, the labor market, personal consumption & housing, manufacturing & trade sales, and inventories & orders.
In a separate survey, the Chicago Fed indicated that its Midwest manufacturing index fell during November to its lowest level since early 1997. The steel, machinery and resource sectors all were weak but the auto sector ticked up very slightly.
| Chicago Fed | December | November | December '07 | 2008 | 2007 | 2006 |
|---|---|---|---|---|---|---|
| CFNAI | -3.26 | -2.78 | -0.96 | -1.69 | -0.39 | 0.00 |
| 3-Month Average | -2.40 | -2.56 | -0.71 | -- | -- | -- |
by Robert Brusca January 26, 2009
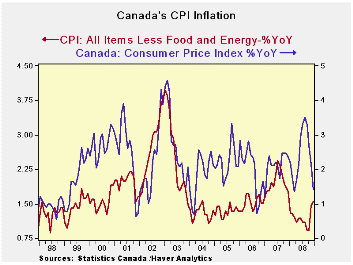
While headline inflation continues to lose steam in Canada as
it does everywhere else in the world, Canada’s core rate is not on that
same page. Over three-months core inflation has escalated to a pace of
+2.6% from under 2% over previous key horizons (see table). By
comparison, Canada’s CPIx, that excludes eight volatile categories
shows inflation remains steady at a pace of 2.2% to 2.4%. This is not a
question about inflation spiking but a question about what sort of
momentum inflation now has in Canada and what pressures the bank of
Canada faces in setting policy. .
The headline rate points clearly lower, with inflation down by
6.1% over three months (annualized) or up by just 1.2% Yr/Yr. Both of
those are good results. The dropping and negative three-month and
six-month results suggest that there may be more relief in inflation to
be passed on to core and nonvolatile items in the months ahead. But for
now Canada’s main inflation trends as depicted by the core or CPIx are
best viewed as moderate and steady.
| Canada's CPI and Core Inflation | |||||||
|---|---|---|---|---|---|---|---|
| % MO/MO | % saar | ||||||
| Dec-08 | Nov-08 | Oct-08 | 3-MO | 6-MO | 12-MO | Yr Ago | |
| All Items | -0.5% | -0.3% | -0.8% | -6.1% | -2.1% | 1.2% | 2.4% |
| All Items SA | -0.4% | -0.3% | -0.6% | -5.1% | -1.6% | 1.4% | 2.4% |
| CPI Core | 0.1% | 0.5% | 0.0% | 2.6% | 1.5% | 1.6% | 1.8% |
| All items Excl 8 Volatile (CPIx) | -0.1% | 0.6% | 0.0% | 2.2% | 2.2% | 2.4% | 1.5% |
| RPIxseas food | -0.3% | 0.6% | 0.2% | 2.2% | 3.9% | 4.1% | 4.3% |
| Food & Non Alcohol Bev | 0.3% | 1.0% | 0.6% | 7.7% | 8.7% | 7.2% | 1.7% |
| Shelter | 0.0% | 0.2% | 0.1% | 1.0% | 1.8% | 3.5% | 4.0% |
| Clothing & Footwear | -0.3% | 0.4% | -0.9% | -3.0% | -3.0% | -2.5% | 0.1% |
| Education | 0.2% | 0.2% | 0.7% | 4.6% | 3.8% | 3.1% | 3.1% |
| Health & Personal Care | 0.2% | 0.5% | 0.1% | 3.0% | 3.4% | 2.0% | 1.3% |
| Transportation | -0.6% | -0.7% | -0.8% | -8.1% | -3.8% | 0.1% | 2.6% |
| A RED highlight indicates inflation accelerating from pace of previous horizon | |||||||
by Louise Curley January 26, 2009
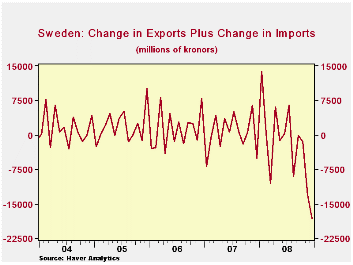
Last week, Robert Brusca noted how the global slowdown was affecting international trade by citing Italy's trade data. Further evidence of the decline in world trade became available today with the release of December trade data for Sweden.
Sweden reported a 12,930 million kronor decline in imports and a 15,259 decline in exports, resulting in an improvement in its balance of trade of 7,479 million kronor for the month of December. But from the standpoint of world trade the fewer exports and fewer imports meant a decline in world trade activity of 18,189 million kronor or $2,760 million.
The attached chart shows the sum of the changes in Sweden's exports and imports over the past five years. The data showed little trend until April of this year. Since then the down trend has been dramatic.
| SWEDEN | Dec 08 | Nov 08 | M/M chg |
|---|---|---|---|
| Balance of Trade (Millions Kroner) | 10163.14 | 2697.76 | 7470.35 |
| Export (Millions Kroner) | 84355.39 | 89714.62 | -5259.23 |
| Imports (Millions Kroner) | 74192.25 | 87021.86 | -12829.61 |
| Change in Exports Plus Change in Imports (Millions Kroner) | 18188.84 | -- | -- |
| Exchange rate (Kroner/US$) | 8.0038 | -- | -- |
| Change in Exports Plus Change in Imports (Millions US$) | 2272.53 | -- | -- |

Tom Moeller
AuthorMore in Author Profile »Prior to joining Haver Analytics in 2000, Mr. Moeller worked as the Economist at Chancellor Capital Management from 1985 to 1999. There, he developed comprehensive economic forecasts and interpreted economic data for equity and fixed income portfolio managers. Also at Chancellor, Mr. Moeller worked as an equity analyst and was responsible for researching and rating companies in the economically sensitive automobile and housing industries for investment in Chancellor’s equity portfolio. Prior to joining Chancellor, Mr. Moeller was an Economist at Citibank from 1979 to 1984. He also analyzed pricing behavior in the metals industry for the Council on Wage and Price Stability in Washington, D.C. In 1999, Mr. Moeller received the award for most accurate forecast from the Forecasters' Club of New York. From 1990 to 1992 he was President of the New York Association for Business Economists. Mr. Moeller earned an M.B.A. in Finance from Fordham University, where he graduated in 1987. He holds a Bachelor of Arts in Economics from George Washington University.
More Economy in Brief


