 Global| Aug 21 2009
U.S. Existing Home Sales Rise With Distress Sales & Tax Credit
by:Tom Moeller
|in:Economy in Brief
Summary
The National Association of Realtors reported that sales of existing homes during July jumped for the fourth consecutive month. The 7.2% m/m rise to 5,240 (SAAR) was to the highest level since August of 2007. The increase in July [...]
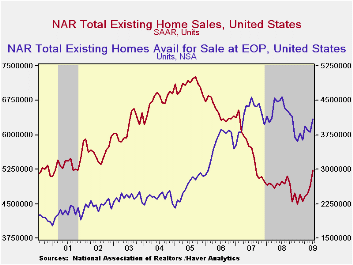
The National Association of Realtors reported that sales of existing homes during July jumped for the fourth consecutive month. The 7.2% m/m rise to 5,240 (SAAR) was to the highest level since August of 2007. The increase in July sales beat Consensus expectations for sales of 5.00M homes. Total sales include sales of condos and co-ops.
Sales of existing single-family homes alone increased 5.5% last month and were up 13.8% from the January low. (These data have a longer history than the total sales series).
Recent sales have been helped by a tax credit for first-time home buyers. The credit of up to $8,000 extends though the end of this year. The full details of the home-buyer tax credit can be found here.
The improvement in home sales looks to have inspired potential
sellers to put more homes on the market. The number of unsold homes
(condos & single-family) for sale rose 7.3% during July to the
highest level since November. Nevertheless, year-to-year inventories
were down 10.6%. At the current sales rate there was a 9.4 months'
supply on the market. The figure was stable with June and was near the
lowest since June 2007. For single-family homes the inventory rose 3.1%
m/m (-13.2% y/y). At the current sales rate there was an 8.6 month's
supply of homes on the market, the lowest since 2007.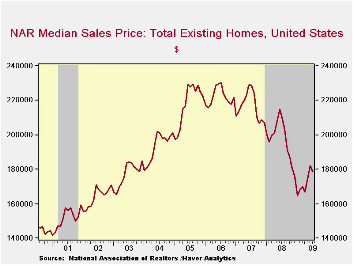
The median price of an existing home dipped m/m to $178,400. Though prices were still lower than the year ago level, they have risen by 8.3% from the January low.
The data on existing home sales, prices and affordability can be found in Haver's USECON database. The regional price, affordability and inventory data is available in the REALTOR database.
Reflections on a Year of Crisis is the title of this morning's speech by Fed Chairman Ben S. Bernanke in Jackson Hole, Wyoming and it is available here.
| Existing Home Sales (Thous, SAAR) | July | June | Y/Y | 2008 | 2007 | 2006 |
|---|---|---|---|---|---|---|
| Total | 5,240 | 4,890 | 5.0% | 4,893 | 5,674 | 6,516 |
| Northeast | 930 | 820 | 3.3 | 845 | 1,010 | 1,093 |
| Midwest | 1,220 | 1,100 | 8.0 | 1,130 | 1,331 | 1,494 |
| South | 1,950 | 1,820 | 5.4 | 1,860 | 2,243 | 2,577 |
| West | 1,130 | 1,150 | 1.8 | 1,064 | 1,095 | 1,357 |
| Single-Family | 4,610 | 4,330 | 5.0 | 4,341 | 4,960 | 5,712 |
| Median Price, Total, $ | 178,400 | 182,000 | -15.1 | 197,250 | 216,633 | 222,042 |
by Robert Brusca August 21, 2009
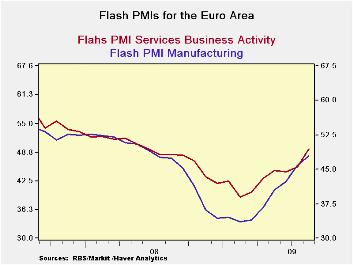
PMI Signals Are Lagging - PMI’s have lagged
the pickup but they are near to neutral and the Markit overview index
has reached the neutral mark of 50 in August. Markit’s overall PMI
reading for the Euro Area rose to this neutral level of 50 in August
lagging behind the GDP signals that in Q2 already turned up for two key
E-Zone countries (Germany and France) and with the Zone’s own GDP
barely falling. Purchaser indices that usually are more sensitive than
other macro-data have not been leading in Europe and that is a point to
ponder.
Large jumps in August play catch-up --
The jumps in the respective MFG and Services indices were large. For
Services it is the largest jump in its history that extends back to
mid-1998. For the MFG index it is the eighth strongest jump in a
history that goes back to mid-1997.
Still, the fact that the big signal from the PMIs is lagging
is a curiosity.
Thinking more about PMIs -- PMI indices are
diffusion indices and formally they are indices of the breadth of
change in a certain direction (up or down, greater or less) rather than
of strength. The overall index is a weighted average of components that
look at specific aspects of an industry getting diffusion responses on
each. However, these indices are used as a proxy for strength since the
correlation with ‘strength’ is high for ‘breadth’. Still we should bear
in mind always that ‘strength’ is not in fact ‘breadth’, they are
different things and sometimes the difference matters, even if most of
the time it does not.
Viva la difference?? If you have never
thought of the PMIs this way before, note that this concept has been
long in play in analyzing trends in the stock market. The stock market
index is a weighted average of stocks, an index that goes up and down,
but technicians also look at indicators of ‘breadth’. And when they do,
they DO NOT call them ‘strength’ but when breadth and strength go
together a rally’s strength is said to be more powerful. Sometimes the
market goes ‘up’ but decliners ‘outpace’ advancers. This is exactly the
same thing as looking at output Vs its diffusion. Output and diffusion
do not always go in the same direction. Manufacturing output is like
the stock index and the MFG PMI is its breath measure. Services output
is compared to the breadth of the services PMI. But in the case of our
economic statistics we get the breadth reports much more quickly than
we get the output reports and so the diffusion indices take on a life
of their own and become proxies for ‘output.’
The diffusion difference - What the
diffusion indices usually do, is to pick up small improvements that
might be scattered around the economy and lost. Diffusion indices
create a signal that would otherwise get lost in the aggregation of
data with weighting always going to the largest of reporters. So this
time around it seems that the opposite is happening. A few larger
reporting firms are doing better and driving the macro -data higher
while the smaller firms are not yet on board for the ride. This is not
surprising with all the government intervention (…in Europe, the UK and
the US, in fact) since government tends to work ‘best’ with big
business. If the assistance works properly (or at all) stimulating
output at the larger firms (like auto makers) should create some
knock-on effects that will draw other firms into the upswing. And the
PMI reports may be signaling that, in August, this is finally
happening. But this process is a bit like trying to start a fire with
wet wood on windy day. Just because you have gotten a spark does not
means you will be able to nurse a bone-warming bonfire out of it.
Still, with a spark, you have a chance. And there is some tentative
evidence that growth is spreading- at last. Getting the diffusion
indices on board is crucial – they remain important barometers of the
success in spreading growth.
| FLASH Readings | ||
|---|---|---|
| Markit PMIs for the E-Zone | ||
| MFG | Services | |
| Aug-09 | 47.87 | 49.53 |
| Jul-09 | 46.25 | 45.69 |
| Jun-09 | 42.62 | 44.65 |
| May-09 | 40.68 | 44.82 |
| Averages | ||
| 3-Mo | 43.18 | 46.53 |
| 6-Mo | 38.98 | 44.58 |
| 12-Mo | 39.28 | 44.11 |
| 127-Mo Range | ||
| High | 60.47 | 62.36 |
| Low | 33.55 | 39.24 |
| % Range | 53.2% | 44.5% |

Tom Moeller
AuthorMore in Author Profile »Prior to joining Haver Analytics in 2000, Mr. Moeller worked as the Economist at Chancellor Capital Management from 1985 to 1999. There, he developed comprehensive economic forecasts and interpreted economic data for equity and fixed income portfolio managers. Also at Chancellor, Mr. Moeller worked as an equity analyst and was responsible for researching and rating companies in the economically sensitive automobile and housing industries for investment in Chancellor’s equity portfolio. Prior to joining Chancellor, Mr. Moeller was an Economist at Citibank from 1979 to 1984. He also analyzed pricing behavior in the metals industry for the Council on Wage and Price Stability in Washington, D.C. In 1999, Mr. Moeller received the award for most accurate forecast from the Forecasters' Club of New York. From 1990 to 1992 he was President of the New York Association for Business Economists. Mr. Moeller earned an M.B.A. in Finance from Fordham University, where he graduated in 1987. He holds a Bachelor of Arts in Economics from George Washington University.