 Global| May 27 2009
U.S. Existing Home Sales Rise As Home Affordability Increases
by:Tom Moeller
|in:Economy in Brief
Summary
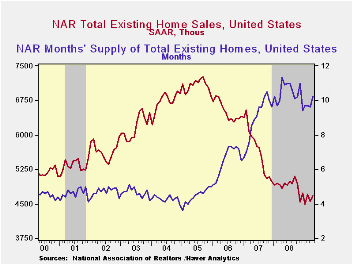
Both home sales and home prices rose slightly last month, according to the National Association of Realtors. The overriding message, however, was that lower prices can spur sales. Sales of existing homes rose 2.9% last month to 4.68M [...]
The price part of the story was provided by the indication that although home prices rose all of 0.2% during April, they were down 15.4% y/y. Moreover, home prices were down by one-quarter from the 2007 peak. These declines in home prices and lower interest rates have gone a long way to increase the affordability of an existing home which is up roughly one-quarter from one year ago and by more than one-half from 2007. The measure fell slightly in the latest two months and the series dates back to 1971.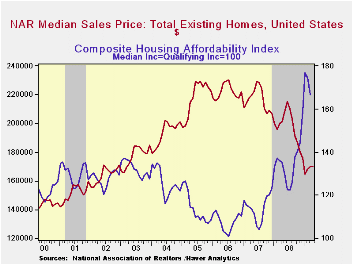
Sales of existing single-family homes alone also reversed most of the March decline with a 2.5% m/m increase to 4.180M units. However, sales remained near the lowest level since July 1997 as they have been essentially flat for the last six months. (These data have a longer history than the total series).
The number of unsold homes (condos & single-family) on the market increased a sharp 8.8% last month but year-to-year inventories are down 12.8%. At the current sales rate there was a 10.2 months' supply on the market which was near the lowest since 2007. For single-family homes the inventory rose a sharp 9.2% during April but it remained low versus last year's high. At the current sales rate there was a 9.6 month's supply, near the lowest since 2007.
The data on existing home sales, prices and affordability can be found in Haver's USECON database. The regional price, affordability and inventory data is available in the REALTOR database.
The Impact of Inflation and Unemployment on Subjective Personal and Country Evaluations from the Federal Reserve Bank of St. Louis can be found here.
| Existing Home Sales (Thous) | April | March | April y/y % | April '08 | 2008 | 2007 | 2006 |
|---|---|---|---|---|---|---|---|
| Total | 4,570 | 4,710 | -7.1 | 4,920 | 4,893 | 5,674 | 6,516 |
| Northeast | 770 | 690 | -10.5 | 860 | 845 | 1,010 | 1,093 |
| Midwest | 1,000 | 1,020 | -9.9 | 1,110 | 1,130 | 1,331 | 1,494 |
| South | 1,740 | 1,710 | -8.9 | 1,910 | 1,860 | 2,243 | 2,577 |
| West | 1,170 | 1,130 | 19.4 | 980 | 1,064 | 1,095 | 1,357 |
| Single-Family | 4,180 | 4,080 | -2.8 | 4,300 | 4,341 | 4,960 | 5,712 |
| Median Price, Total, $ | 170,200 | 169,900 | -15.4 | 201,300 | 197,250 | 216,633 | 222,042 |
by Tom Moeller May 27, 2009
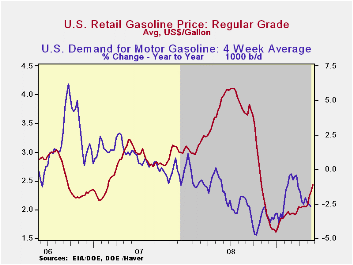
The news that the U.S. economy, notably the consumer, is recovering from the Winter doldrums has given further life to energy prices. Suspecting that a more confident consumer will drive further, regular gasoline prices last week continued their recent upturn and rose to an average $2.44 per gallon of regular. The gains have taken prices up by 82 cents, or by one-half, from the December low to the highest level since early-November. Yesterday, cash market prices traded higher still at $1.80 per gallon versus $1.78 averaged last week and these were the highest prices since last October. The figures are reported by the U.S. Department of Energy and can be found in Haver's WEEKLY & DAILY databases.
A strengthening of crude oil prices has continued together with the gains in gasoline costs. Crude prices averaged $60.48 last week for a barrel of West Texas Intermediate, up from the December low of $32.37 per barrel. Yesterday, crude oil prices rose even further to $62.45. Prices reached a high of $145.66 last July. The latest increases occurred despite a 2.7% year-to-year rise in crude oil production during the latest four weeks. The figures on crude oil production are available in Haver's OILWKLY database.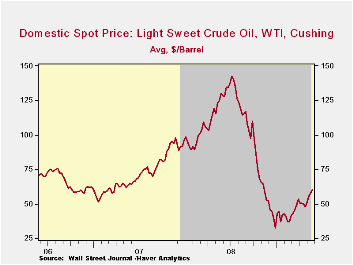
For the moment, higher gasoline prices & economic weakness continue to lower gasoline demand, last week by 2.7% y/y. The change in demand is measured using the latest four weeks versus the same four weeks in 2008. Demand for all petroleum products was down 7.6% y/y led by a 38.8% drop in demand for residual fuel oil and a 14.9% drop in distillate demand. In addition, the price gains have occurred despite an 11.0% rise in inventories of crude oil & petroleum products. These numbers also are available in Haver's OILWKLY database.
Finally, the gains in the price of natural gas paused last week and it fell back to $3.77 per mmbtu (-66.6% y/y). The latest price was nearly the lowest since 2002 and is down by two-thirds from the high reached in early-July of $13.19/mmbtu.
Prospects for Oil Market Stability from the International Monetary Fund can be found here.
| Weekly Prices | 05/25/09 | 05/18/09 | Y/Y | 2008 | 2007 | 2006 |
|---|---|---|---|---|---|---|
| Retail Regular Gasoline ($ per Gallon, Regular) | 2.44 | 2.31 | -38.2% | 3.25 | 2.80 | 2.57 |
| Light Sweet Crude Oil, WTI ($ per bbl.) | 60.48 | 58.07 | -53.5% | 100.16 | 72.25 | 66.12 |
by Tom Moeller May 27, 2009
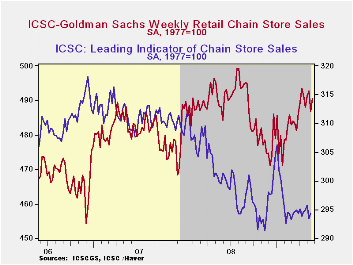
Perhaps consumer spending is holding together after an earlier indication of retrenchment. According to the International Council of Shopping Centers-Goldman Sachs Index, store sales last week recovered most of the prior week's decline with a 0.8% increase. The news for the whole month is far from strong, however, as chain store sales in May are down just slightly from April after that month's 1.4% rise from the March average.
During the last ten years there has been a 64% correlation between the year-to-year growth in chain store sales and the growth in general merchandise sales. These weekly figures are available in Haver's SURVEYW database.The ICSC-Goldman Sachs retail chain-store sales index is constructed using the same-store sales (stores open for one year) reported by 78 stores of seven retailers: Dayton Hudson, Federated, Kmart, May, J.C. Penney, Sears and Wal-Mart.
Prospects for spending similarly are far from ebullient as indicated by the leading indicator of sales. It increased a modest 0.3% in the latest week, a gain which also lifted the May average to just below April.
The Persistent Effects of a False News Shock from the Federal Reserve Bank of New York can be found here.
| ICSC-UBS (SA, 1977=100) | 05/16/09 | 05/09/09 | Y/Y | 2008 | 2007 | 2006 |
|---|---|---|---|---|---|---|
| Total Weekly Chain Store Sales | 490.5 | 486.8 | 0.5% | 1.4% | 2.8% | 3.3% |

Tom Moeller
AuthorMore in Author Profile »Prior to joining Haver Analytics in 2000, Mr. Moeller worked as the Economist at Chancellor Capital Management from 1985 to 1999. There, he developed comprehensive economic forecasts and interpreted economic data for equity and fixed income portfolio managers. Also at Chancellor, Mr. Moeller worked as an equity analyst and was responsible for researching and rating companies in the economically sensitive automobile and housing industries for investment in Chancellor’s equity portfolio. Prior to joining Chancellor, Mr. Moeller was an Economist at Citibank from 1979 to 1984. He also analyzed pricing behavior in the metals industry for the Council on Wage and Price Stability in Washington, D.C. In 1999, Mr. Moeller received the award for most accurate forecast from the Forecasters' Club of New York. From 1990 to 1992 he was President of the New York Association for Business Economists. Mr. Moeller earned an M.B.A. in Finance from Fordham University, where he graduated in 1987. He holds a Bachelor of Arts in Economics from George Washington University.
More Economy in Brief


