Global| Oct 23 2009
U.S. Existing Home Sales Jump ButPrices Decline Again
by:Tom Moeller
|in:Economy in Brief
Summary
Home sales continue to recover, helped by lower prices. The National Association of Realtors reported that September sales of existing homes rose sharply to the highest level since July 2007. The 9.4% m/m increase to 5.570M units [...]
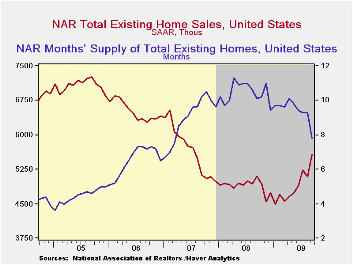
Home sales continue to recover, helped by lower prices. The National Association of Realtors reported that September sales of existing homes rose sharply to the highest level since July 2007. The 9.4% m/m increase to 5.570M units (SAAR) followed a 2.9% July decline that was little revised. Moreover, the increase in September home sales outpaced Consensus expectations for a rise to 5.35M. Total sales include sales of condos and co-ops.
Sales of existing single-family homes alone similarly increased a sharp 9.4% to 4.890M last month and were up 20.7% from the January low. (These data have a longer history than the total sales series).
Recent sales have been helped by a tax credit for first-time home buyers. The credit of up to $8,000 extends though the end of this year. The full details of the home-buyer tax credit can be found here.
The median price of an existing home fell for the third
straight month, to $174,900. Though prices were still lower than the
year-ago level, they have risen 6.1% from the January low. The median
price for a single-family home was $174,900 (-8.1% y/y). These price
declines have sharply raised home affordability. During August, the
composite index of home affordability reversed all of its July decline
and rose 2.3%. It was up 26.5% from August of last year but down 10.1%
from its January peak due to a limited decline in interest rates.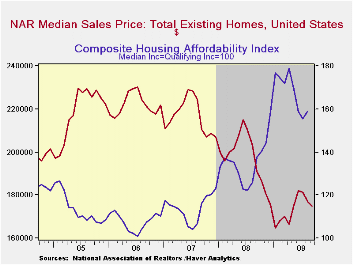
Perhaps due to lower prices, potential sellers put fewer homes on the market. The number of unsold homes (condos & single-family) for sale fell 7.5% (-15.0% y/y) during September to near the lowest level since January 2007. Year-to-year inventories were down 15.0%. At the current sales rate there was a 7.8 months' supply on the market which was near the lowest since early-2007. The latest figure was down from a high of 11.3 months early last year. For single-family homes the inventory fell 9.1% m/m (-16.7% y/y). At the current sales rate there was a 7.6 month's supply of homes on the market, the lowest since early-2007.
The data on existing home sales, prices and affordability can be found in Haver's USECON database. The regional price, affordability and inventory data is available in the REALTOR database.
Financial Regulation and Supervision after the Crisis: The Role of the Federal Reserve is the title of this morning's speech by Fed Chairman Ben S. Bernanke and it is available here.
| Existing Home Sales (Thous, SAAR) | September | August | Y/Y | 2008 | 2007 | 2006 |
|---|---|---|---|---|---|---|
| Total | 5,570 | 5,090 | 9.2% | 4,893 | 5,674 | 6,516 |
| Northeast | 950 | 910 | 11.8 | 845 | 1,010 | 1,093 |
| Midwest | 1,250 | 1,140 | 7.8 | 1,130 | 1,331 | 1,494 |
| South | 2,060 | 1,890 | 10.8 | 1,860 | 2,243 | 2,577 |
| West | 1,300 | 1,150 | 5.7 | 1,064 | 1,095 | 1,357 |
| Single-Family | 4,890 | 4,470 | 7.7 | 4,341 | 4,960 | 5,712 |
| Median Price, Total, $ | 174,900 | 177,300 | -8.5 | 197,250 | 216,633 | 222,042 |
by Tom Moeller October 23, 2009
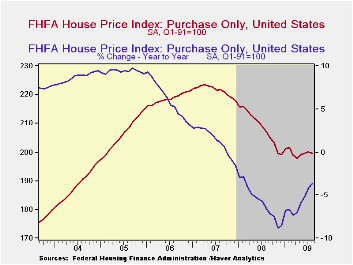 The decline in home prices continued to moderate according the
U.S. House Price Index from the Federal Housing and Finance Agency
(FHFA). The Purchase Only Index for August fell 0.3% and reversed its
July increase. Nevertheless, the year-to-year decline in the nationwide
average of home prices eased to -3.6% from its worst reading of -8.8%
last November. Since their peak in early-2007 home prices nationwide
have fallen 10.7%. The FHFA uses data provided by Fannie Mae and
Freddie Mac and is not value-weighted.
The decline in home prices continued to moderate according the
U.S. House Price Index from the Federal Housing and Finance Agency
(FHFA). The Purchase Only Index for August fell 0.3% and reversed its
July increase. Nevertheless, the year-to-year decline in the nationwide
average of home prices eased to -3.6% from its worst reading of -8.8%
last November. Since their peak in early-2007 home prices nationwide
have fallen 10.7%. The FHFA uses data provided by Fannie Mae and
Freddie Mac and is not value-weighted.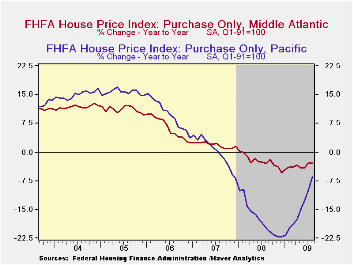
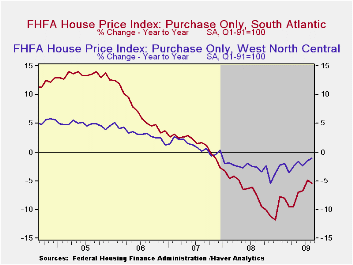
Notable monthly declines in home prices during August were
logged in the South Atlantic and the New England regions of the
country, though the y/y declines have moderated significantly.
Conversely, prices in the Mountain and in the Pacific regions recovered
m/m but remain down the most of the country's regions versus last
August. 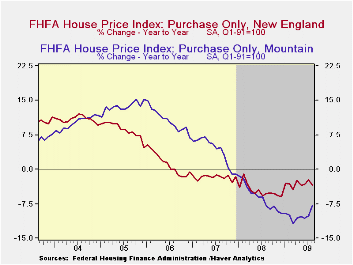 Prices in the Middle Atlantic and in the East North Central
Regions also fell moderately during August but the y/y declines have
moderated significantly this year.
Prices in the Middle Atlantic and in the East North Central
Regions also fell moderately during August but the y/y declines have
moderated significantly this year.
In the populous East North Central region prices slipped another 0.6% during August but they were flat year-to-date. Prices also slipped in the West South Central region but have risen slightly since December.
 Mideast Oil Exporters Face the Crisis Ahead from
the International Monetary Fund can be found here.
Mideast Oil Exporters Face the Crisis Ahead from
the International Monetary Fund can be found here.
| FHFA U.S. House Price Index Purchase Only (%) | August | July | Y/Y | 2008 | 2007 | 2006 |
|---|---|---|---|---|---|---|
| Total | -0.3 | 0.3 | -3.6 | -5.8 | 1.3 | 6.0 |
| New England | -1.1 | -0.1 | -3.4 | -4.6 | -1.7 | 1.1 |
| Middle Atlantic | -0.6 | 0.9 | -2.8 | -2.3 | 1.9 | 6.3 |
| East North Central | -0.6 | -0.1 | -3.4 | -4.4 | -1.3 | 1.8 |
| West North Central | 0.2 | 0.1 | 1.0 | -2.8 | 1.0 | 3.2 |
| South Atlantic | -1.6 | 1.2 | -5.5 | -7.1 | 1.4 | 7.1 |
| East South Central | 0.4 | -1.1 | -0.7 | -1.4 | 3.8 | 7.2 |
| West South Central | -0.0 | -0.6 | 0.4 | 0.7 | 4.7 | 7.2 |
| Mountain | 0.3 | -0.0 | -7.8 | -6.0 | 4.0 | 10.6 |
| Pacific | 1.1 | 0.9 | -6.5 | -17.3 | 0.1 | 9.8 |
by Robert Brusca October 23, 2009
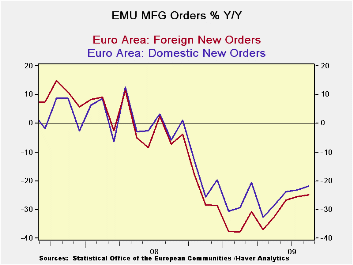
The EMU economy continues to spin off better economic signals. Orders rose by 2% in August after a 3% rise in July and a 4.2% gain in June. As a result the sequential growth rates are showing explosive growth in orders- up at a 43% annual rate over three months - still orders are lower Yr/Yr by over 20%. EMU MFG sales were up in August, too, and they show sequential growth rates are improving.
Orders rose in two of the four largest economies as Italy and the UK took order setbacks in August. Italy and the UK also show dropping orders over three months.
The UK took a set back in growth as GDP dropped 0.4% Q/Q in Q3 (a 1.6% annualized rate of decline) an unexpected result that extends the UK recession that was thought to have ended. Italy ’s sharper drop in orders of 8.6% raises some questions there. The UK GDP drop has brought pressure on sterling as one might well have expected, but the weakness in Italy is another matter as it is safely cocooned within the euro area. We do not know how badly Italy ’s orders drop will affect the economy but retail sales have faltered recently. Consumers and businesses are seeing and expecting totally different trends there. The hardest thing for EMU policymakers is to have countries within the Zone moving in different directions.
| Euro Area and UK Industrial Orders & Sales Trends | |||||||||
|---|---|---|---|---|---|---|---|---|---|
| Saar except m/m | % m/m | Aug 09 |
Aug 09 |
Aug 09 |
Aug 08 |
Aug 07 |
Qtr 2 Date |
||
| Euro Area | Aug 09 |
Jul 09 |
Jun 09 |
3 Mo | 6 mo | 12 mo | 12 mo | 12 mo | Saar |
| Manufacturing Sales | 1.0% | 1.6% | -0.9% | 7.1% | 2.3% | -19.6% | 3.5% | 5.8% | 11.2% |
| Intermediate | -3.7% | 4.8% | 6.8% | 34.6% | 3.2% | -21.4% | 2.0% | 9.0% | #N/A |
| Manufacturing Orders | 2.0% | 3.0% | 4.2% | 43.7% | 20.4% | -21.8% | -2.1% | 4.7% | 37.5% |
| Countries: | Aug 09 |
Jul 09 |
Jun 09 |
3Mo | 6mo | 12mo | 12mo | 12-mo | Qtr 2 Date |
| Germany: | 1.8% | 2.0% | 4.1% | 36.9% | 33.2% | -24.7% | -1.0% | 6.0% | 30.5% |
| France: | 3.0% | 4.1% | 1.5% | 39.8% | 6.1% | -13.8% | -7.7% | 8.1% | 43.8% |
| Italy | -8.6% | 2.1% | 1.6% | -19.0% | -18.8% | -29.8% | -3.4% | -1.6% | -34.5% |
| UK(EU) | -15.6% | 7.3% | 3.6% | -22.5% | 1.3% | -11.1% | -12.6% | 4.3% | -48.8% |
Markit PMIS are up-beat - The goods news for EMU was that the Markit monthly look-ahead PMI reading for October improved overall and for each of MFG and Services. The MFG reading actually showed expansion for the first time since May of 2008. Overall the EMU area seems to be continuing its progress despite Italy ’s troubles.
Adding to the sense of good news in the face of the UK ’s ominous GDP drop was an improvement in Germany ’s IFO index as business climate improved along with current conditions and expectations.
A background report from the OECD demonstrated that world trade flows had stabilized in 2009-Q2. To be sure it remains a day of mixed data but putting the UK ’s GDP report aside the news elsewhere was pretty upbeat. Dropping UK GDP is a big fly in the ointment, but on the whole the signals from the UK economy have not turned uniformly glum. Until GDP was reported, based on data in hand, economists had expected a rise in GDP. Sometimes GDP accounting can have this effect. While GDP is the best comprehensive measure of how an economy is doing, around economic turning points oddities with trade and inventories can send mixed the signals more than they should. While we need to be wary of the UK economy’s performance, on the whole the global economy seems to be in an upswing and doing better. Ultimately that will help the UK too.

Tom Moeller
AuthorMore in Author Profile »Prior to joining Haver Analytics in 2000, Mr. Moeller worked as the Economist at Chancellor Capital Management from 1985 to 1999. There, he developed comprehensive economic forecasts and interpreted economic data for equity and fixed income portfolio managers. Also at Chancellor, Mr. Moeller worked as an equity analyst and was responsible for researching and rating companies in the economically sensitive automobile and housing industries for investment in Chancellor’s equity portfolio. Prior to joining Chancellor, Mr. Moeller was an Economist at Citibank from 1979 to 1984. He also analyzed pricing behavior in the metals industry for the Council on Wage and Price Stability in Washington, D.C. In 1999, Mr. Moeller received the award for most accurate forecast from the Forecasters' Club of New York. From 1990 to 1992 he was President of the New York Association for Business Economists. Mr. Moeller earned an M.B.A. in Finance from Fordham University, where he graduated in 1987. He holds a Bachelor of Arts in Economics from George Washington University.
More Economy in Brief
U.K. Headline and Core Inflation Rates Slow Sequentially as BOE Gets Ready to Meet