 Global| Apr 22 2008
U.S. Existing Home Sales Fell, Prices Rose
by:Tom Moeller
|in:Economy in Brief
Summary
According to the National Association of Realtors, March sales of existing home sales fell 2.0% m/m to 4.930M. The drop reversed most of February's unrevised 2.9% increase and it was as expected. The downward momentum behind last [...]
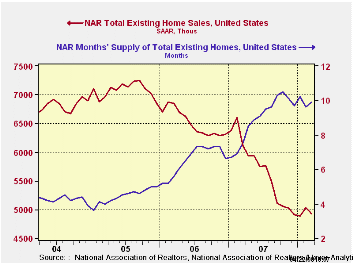
According to the National Association of Realtors, March sales of existing home sales fell 2.0% m/m to 4.930M. The drop reversed most of February's unrevised 2.9% increase and it was as expected.
The downward momentum behind last year's sales declines continued to look like it's flattened out. During the last three months sales were about even with the yearend '07 level.
Despite a 2.6% one month rise in median home prices,
the trend still is lower. The gain followed three consecutive months of
decline and the three month average of home prices fell to a new cycle
low, 12.6% below the high last August.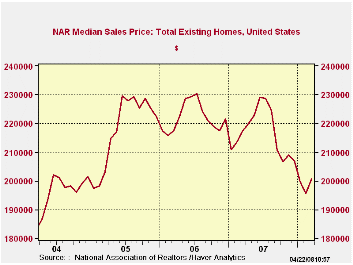
Sales of existing single family homes in March fell 2.7% to 4.350M and reversed all of February's gain.
By region, home sales in the Midwest fell a hard 6.5% (-15.9% y/y) while sales in the South also fell by 3.5% (-20.0% y/y). In the Northeast sales rose for the second consecutive month following three months of decline. Sales in the West rose a modest 2.2% after two months of decline.
The number of unsold homes on the market rose a modest 1.0% (6.6% y/y). At the current sales rate the inventory still amounts to a 9.9 months supply which is barely down from last year's peak. For single family homes there is a 9.5 months supply at the current sales rate and for condos and co-ops there is a 12.8 months supply.
New Monetary Policy Tools? from the Federal Reserve Bank of St. Louis can be found here.
| Existing
Single Family Home Sales (Thous) |
March | y/y % | February | March '07 | 2007 | 2006 | 2005 |
|---|---|---|---|---|---|---|---|
| Total | 4,930 | -19.3 | 5,030 | 6,110 | 5,672 | 6,508 | 7,076 |
| Northeast | 910 | -18.8 | 890 | 1,120 | 1,008 | 1,090 | 1,168 |
| Midwest | 1,160 | -15.9 | 1,240 | 1,380 | 1,331 | 1,491 | 1,589 |
| South | 1,920 | -20.0 | 1,990 | 2,400 | 2,240 | 2,576 | 2,704 |
| West | 940 | -22.3 | 920 | 1,210 | 1,093 | 1,353 | 1,617 |
| Single-Family | 4,350 | -18.4 | 4,470 | 5,330 | 4,958 | 5,703 | 6,181 |
| Median Price, Total, $ | 200,700 | -7.7 | 195,600 | 217,400 | 216,617 | 222,000 | 218,217 |
by Tom Moeller April 22, 2008
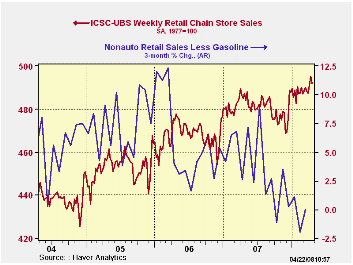
According to the International Council of Shopping Centers ICSC-UBS Chain Store survey, sales slipped 0.7% last week and took back about all of the prior week's gain.
Despite the latest decline sales so far in April have risen 0.8% from March, due to gains early in the month. Chain store sales in March were about unchanged from February.During the last ten years there has been a 45% correlation between the y/y change in chain store sales and the change in nonauto retail sales less gasoline.
The ICSC-UBS retail chain-store sales index is constructed using the same-store sales (stores open for one year) reported by 78 stores of seven retailers: Dayton Hudson, Federated, Kmart, May, J.C. Penney, Sears and Wal-Mart.
During the latest week the leading indicator of chain store sales from ICSC-UBS fell 0.5% (-2.0% y/y) and reversed most of the prior week's gain.
Opportunity Knocks: Selling Our Services to the Rest of the World from the Federal Reserve Bank of Dallas and it is available here.
| ICSC-UBS (SA, 1977=100) | 04/19/08 | 04/12/08 | Y/Y | 2007 | 2006 | 2005 |
|---|---|---|---|---|---|---|
| Total Weekly Chain Store Sales | 491.8 | 495.3 | 1.4% | 2.8% | 3.3% | 3.6% |
by Tom Moeller April 22, 2008
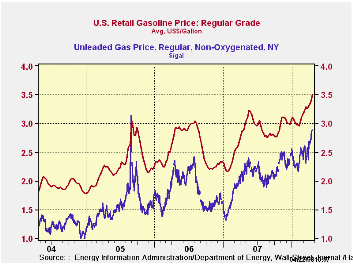
The retail price for a gallon of regular gasoline topped $3.50 last week. According to the U.S. Department of Energy survey, prices rose twelve cents w/w to a new record of $3.51 per gallon.
Higher prices on the spot market drove the rise and as of
yesterday, the wholesale price of gasoline was up another six cents
from last week's average.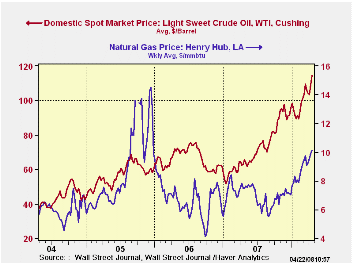
Strength in crude oil prices is behind the strength in gasoline prices. Yesterday's price of $117.48 for a barrel of WTI crude compared to an average $114.41 last week.
Prices for natural gas also have been notably strong. The wholesale price of $10.13 per mmbtu was not a record but it was up by more than one-third from last year.
Energy and the Economy from the Federal Reserve Bank of St. Louis can be found here.
Deliverability and Regional Pricing in U.S. Natural Gas Markets is a working paper from the Federal Reserve Bank of Dallas and it can be found here.
| Weekly Prices | 04/21/08 | 04/14/08 | Y/Y | 2007 | 2006 | 2005 |
|---|---|---|---|---|---|---|
| Retail Gasoline ($ per Gallon) | 3.51 | 3.39 | 22.3% | 2.80 | 2.57 | 2.27 |
| Light Sweet Crude Oil, WTI ($ per bbl.) | 114.41 | 108.93 | 81.4% | 94.00 | 61.11 | 58.16 |
by Louise Curley April 22, 2008
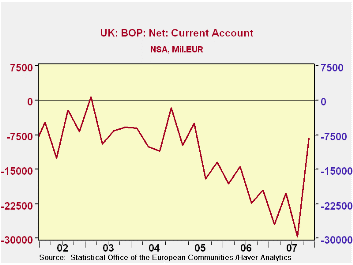
The 27 countries in the European Union reported a current account deficit of $2.8 billion for the fourth quarter of 2007, a decrease of $18.4 billion from the third quarter. A major factor in the decline was the reduction in the deficit of the United Kingdom, which declined from $29.7 billion to $8.2 billion. (See the first chart.) For the year as a whole the deficit declined from $82.9 billion in 2006 to $72.4 billion in 2007.
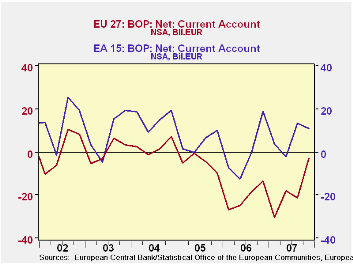
Within the European Union, the fifteen countries of the Euro Area reported a surplus of $11.0 billion in the fourth quarter, a decline from the $13.6 of the third year. For the entire year, 2007, the Euro Area reported a surplus of $26.4 billion in contrast to a deficit of $1.3 billion in 2006. The second chart compares the current account balances of the entire EU area and the Euro Area.
In the fourth quarter the EU reported surpluses with the United States ($33.6 bil.), Switzerland ($9.2 bil,), Canada $4.9 bil.), India($2.2 bil.) and Hong Kong ($2.2 bil.); and deficits with China (38.6 bil.), Russia ($8.7 bil.) and Japan ($6.2 bil.).
| CURRENT ACCOUNTS IN THE EUROPEAN UNION (BIL. US$) | Q4 07 | Q3 07 | Q2 07 | Q1 07 | Q4 06 | Q/Q Chg | Y/Y Chg | 2007 | 2006 | 2005 |
|---|---|---|---|---|---|---|---|---|---|---|
| EU 27 | -2.8 | -21.2 | -18.1 | -30.4 | -13.4 | 18.4 | 10.6 | -72.4 | -82.9 | -19.6 |
| U.K. | -8.3 | -29.8 | -20.2 | -26.9 | -19.0 | 21.5 | 10.7 | -85.1 | -74.5 | -45.3 |
| EA 15 | 11.0 | 13.6 | -2.0 | 3.7 | 18.9 | -2.6 | -7.0 | 26.4 | -1.3 | 18.1 |
| EA15: Austria, Belgium, Finland, France, Germany, Greece, Ireland, Italy, Japan, Luxembourg, Portugal, Spain, Cyprus, Malta, Slovenia | ||||||||||
| EU 27: EA 15 Plus: Bulgaria, the Czech Republic, Denmark, Estonia, Slovakia, Sweden, United Kingdom, Hungary, Latvia, Lithuania, Slovenia, Slovakia | ||||||||||
by Robert Brusca April 24, 2008
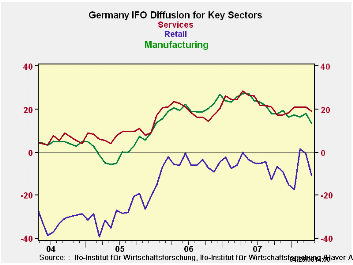
Germany’s IFO index has dropped sharply in March to 102.4 from 104.8. Its current conditions index fell to 109.4 from 111.5. The April expectations index moved lower to 96.8 from 98.4. On a Yr/Yr basis the percentage declines in the IFO index accelerated for each of these components (see table below).
The readings for the IFO and its components are not yet dour, but they clearly have weakened and are no longer strong. The Business Climate index stands in the 73rd percentile of its range, a firm reading. The current situation is a bit better than that, lodged at its 78th percentile. Expectations, the forward-looking indicator, are weaker; still standing in the 60th percentile of their range. That is still above the midpoint but longer looking very strong and certainly losing momentum. Expectations readings, while above their range mid point stand at their period average at a value of 96.8.
The sector indices tell curious stories. Compared to their respective average values since January of 2001, all are still well above average. But all are not well-off. Retailing is the most curious having moved strongly higher earlier this year even as the euro was gaining in value. But in April it is falling sharply even as it was retaining some of those gains. The message from this sector is not clear. It resides in the 78th percentile of its range. In that respect it is the relative strongest of the sectors in its range since 2001. Wholesaling is the weakest sector residing in the 65th percentile of its range. MFG Construction and retailing are in the low seventieth percentiles of their respective ranges. All of them fell in the month, retailing fell the mostly sharply shedding 10 points in one month. Wholesaling lost over 6 points on its diffusion index. Manufacturing lost about four and one-half points.
It was not a good month for the IFO report that was generally worse than the Zew index has suggested. The IFO’s details are yet to be revealed. A MFG morale report from neighboring France, a fellow EMU member, (also released today) showed that French morale was off and that orders had dropped sharply. That result accords with the Belgian National Bank index released on Wednesday, just one day ago. We are getting confirming signs with similar causes about spreading weakness in the Euro Area. Even the UK’s CBI MFG survey showed a similar pattern of weakness made more nettlesome by reports that more firms were passing through price increases.
The reports for the EMU in the coming months are going to be important. On today’s weakness the Euro shed a large dollop of its recent outsized dollar gains. The ECB rhetoric about tightening rates has done a quick 180-degree turn, suddenly the IMF is pleased with the state of ECB policy and the ECB itself no longer seems to threaten a rate-hiking agenda.
What a difference a few bad economic reports can make. Stay tuned as we try to discern how weak things will get. For its part the German government has not cut its growth rate further for 2008 but has lowered the outlook for 2009. In the face of all the complaining that the euro is too strong, some of this is going have to undergo a credibility check. If the euro is far, far above parity (and seems to suggest that is so) then the recent strength in a number of euro indicators would seem to at risk. More weak readings from the IFO and its companion reports must lie ahead. All this talk of a resilient and robust economy in Europe surely must be about to go by the boards.
| IFO Survey: Germany | ||||||||
|---|---|---|---|---|---|---|---|---|
| Percent: Yr/Yr | INDEX NUMBERS | |||||||
| Apr-08 | Mar-08 | Feb-08 | Jan-08 | Dec-07 | CURRENT | Average | Percentile | |
| Biz Climate | -5.7% | -2.7% | -2.7% | -4.2% | -5.3% | 102.4 | 96.0 | 73.1% |
| Current Situation | -4.2% | -0.7% | -1.1% | -4.3% | -6.2% | 108.4 | 95.2 | 78.6% |
| Biz Expectations | -7.2% | -4.7% | -4.4% | -4.1% | -4.3% | 96.8 | 96.8 | 60.5% |

Tom Moeller
AuthorMore in Author Profile »Prior to joining Haver Analytics in 2000, Mr. Moeller worked as the Economist at Chancellor Capital Management from 1985 to 1999. There, he developed comprehensive economic forecasts and interpreted economic data for equity and fixed income portfolio managers. Also at Chancellor, Mr. Moeller worked as an equity analyst and was responsible for researching and rating companies in the economically sensitive automobile and housing industries for investment in Chancellor’s equity portfolio. Prior to joining Chancellor, Mr. Moeller was an Economist at Citibank from 1979 to 1984. He also analyzed pricing behavior in the metals industry for the Council on Wage and Price Stability in Washington, D.C. In 1999, Mr. Moeller received the award for most accurate forecast from the Forecasters' Club of New York. From 1990 to 1992 he was President of the New York Association for Business Economists. Mr. Moeller earned an M.B.A. in Finance from Fordham University, where he graduated in 1987. He holds a Bachelor of Arts in Economics from George Washington University.
More Economy in Brief


