 Global| May 23 2008
U.S. Existing Home Sales % Decline Eased
by:Tom Moeller
|in:Economy in Brief
Summary
The National Association of Realtors reported that April sales of existing homes fell 1.0% m/m to 4.89M. The decline was to the lowest level in the nine year history of the series and it was about as expected. Total sales include [...]
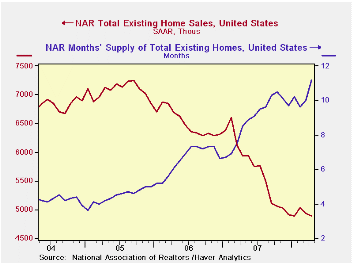
The National Association of Realtors reported that April sales of existing homes fell 1.0% m/m to 4.89M. The decline was to the lowest level in the nine year history of the series and it was about as expected. Total sales include sales of condos and co-ops.
The past weakness in home sales may, however, have eased. The level of April sales was equal to this past January's. That unchanged level contrasts with a -40.4% three-month rate of growth this past October.
Sales of existing single family homes fell a lesser 0.5% last month and the y/y decline of 16.1% also is somewhat less than the decline in overall sales. Like the overall series, sales were about level with this past Winter and the near-zero rate of decline contrasts with a roughly -40% growth rate this past Winter. Regardless, the series for single family homes (which has a longer history than the total) indicated that sales were at the lowest level since early 1998.
Median home prices rose 1.1% last month
after a 2.3% March rise. Here again, recent downward momentum may have
changed with the three-month average home price up at a 5.3% rate
versus a 33% rate of decline last October. Indeed, prices may have
firmed with sales but prices typically firm with the passage of Winter.
And the recent 5.3% growth rate is well below that of past years.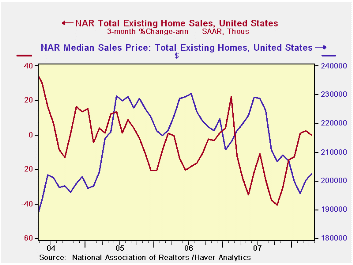
By region, home sales in the West provided all of the lift to the April total with a 6.4% gain and the three month change in sales improved to 33.7% (AR). Elsewhere sales were less robust. In the South April sales were unchanged and three month growth was still negative at -6.0%. In the Midwest April sales fell 6.0% and the three month growth rate remained at -31.7%. In the Northeast April sales fell 4.4% but three month growth showed more firmness at 39.9%.
Any improvement in sales last month failed to lower the number of unsold homes on the market which rose 10.5% (7.9% y/y). Again, seasonal patterns may have influenced that figure as the y/y change in inventories was just 7.9% and that compared to gains of 20% to 40% during the last two years. At the current sales rate the inventory still amounts to 11.2% months supply which is a record series high. For single family homes there was a 10.7 months supply at the current sales rate.
Measuring Core Inflation: Notes from a 2007 Dallas Fed Conference can be found here.
Measurement of Unemployment from the Federal Reserve Bank of Boston is available here.
| Existing
Single Family Home Sales (Thous) |
April | y/y % | March | April '07 | 2007 | 2006 | 2005 |
|---|---|---|---|---|---|---|---|
| Total | 4,890 | -17.5 | 4,940 | 5,930 | 5,672 | 6,508 | 7,076 |
| Northeast | 870 | -14.7 | 910 | 1,020 | 1,008 | 1,090 | 1,168 |
| Midwest | 1,100 | -19.7 | 1,170 | 1,370 | 1,331 | 1,491 | 1,589 |
| South | 1,920 | -18.6 | 1,920 | 2,360 | 2,240 | 2,576 | 2,704 |
| West | 1,000 | -15.3 | 940 | 1,180 | 1,093 | 1,353 | 1,617 |
| Single-Family | 4,340 | -16.1 | 4,360 | 5,170 | 4,958 | 5,703 | 6,181 |
| Median Price, Total, $ | 202,300 | -8.0 | 200,100 | 219,900 | 216,617 | 222,000 | 218,217 |
by Robert Brusca May 23, 2008
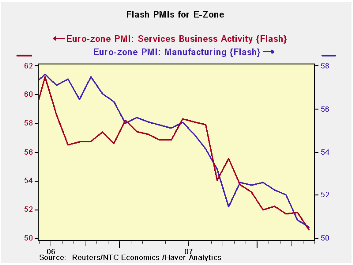
The chart is pretty clear. The table is pretty clear. The Euro Area is pretty certainly on a still-declining path - and that path is not showing any slowing. Growth is not contracting yet. But with the two main sector PMIs teetering on the brink of a neutral ‘50’ reading ‘contraction’ isn’t just a word with an apostrophe. It’s a real threat.
The tabular data remind us that over this horizon both indexes are on their respective low readings for the period. A longer period of calculation for the MFG PMI shows it standing in the 43rd percentile of its range since mid-1997. The reading in May 2008 is at 96.1% of its average for the longer period. Put another way however, if we rank the various MFG readings we find that the current reading ranks 95th out of 132 observations back to mid 1997. That means in terms of ranking it is in the BOTTOM 28th percentile of all MFG readings of that time – a very weak result.
The history of the MFG survey is longer that for services. And while 28% isn’t as weak as 0%, it is a more powerful number since it is for a longer period of time when real weakness has visited the Euro Area. Lying firmly in the bottom third of its range, the MFG reading is not emitting signals that are very reassuring. The MFG PMI has been below 50 only 30 times. The last time was in June 2005 (a streak of three consecutive sub 50 readings). This month’s reading is the weakest since August of 2005, just after that streak. It’s a disturbing report for the Euro Area and possibly a warning about the future.
| FLASH Readings | ||
|---|---|---|
| NTC PMIs for the E-Zone-13 | ||
| MFG | Services | |
| May-08 | 50.52 | 50.59 |
| Apr-08 | 50.85 | 51.78 |
| Mar-08 | 52.01 | 51.69 |
| Feb-08 | 52.25 | 52.25 |
| Averages | ||
| 3-Mo | 51.13 | 51.35 |
| 6-Mo | 51.78 | 51.93 |
| 12-Mo | 52.70 | 54.10 |
| 24-Mo Range | ||
| High | 57.61 | 61.21 |
| Low | 50.52 | 50.59 |
| % Range | 0.0% | 0.0% |
by Robert Brusca May 23, 2008
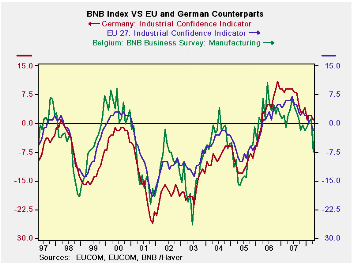
BNB index is a harbinger for the Euro Area. The BNB index plunged sharply in April and is moderately lower again in May. This month the NTC diffusion indexes for the Euro Area came out slightly ahead of the Belgian index and they already tell a stogy of a weakening EMU. The Belgian index adds wood to that fire. This early read on EMU health in April has been a GOOD SOLID barometer of what the larger and geographically linked key EMU economies will report for the month. The accompanying chart shows the tracking of the Belgian industrial index – usually the one of the first reads on the Euro Area and EU in any given month - with the EU’s industrial index and with the EU Commission index for Germany. The Belgian index has often moved ahead of the EU and German indexes. In this episode, the Belgian index had started to strengthen ahead of any such signs for Germany and EU before posting this recent drop. So the plunge in Belgium in April overstated the extent of the drop we saw in Germany and in EU but the BNB MFG index’s flat reading at this low level in May reinforces this negative trend. In any event, the smaller Belgian economy often sees its BNB index move more sharply than the indexes for Germany and the EU but it is generally a good ‘hint’ for them and is not to be ignored. The weak NTC indexes this month underscore that message.
MFG sector is weak. The BNB index shows us widespread weakness in Belgium. The MFG index (an up minus down net reading, like all the other components) is at zero after a -7.4, in May which was the weakest since it was at -10.5 in August of 2005. The current (just released) NTC MFG weakness in May is also the weakest reading it has posted since August of 2005 – Belgium told us that last month. The domestic production reading in Belgium rebounded to +7 from +2 in April. The domestic and foreign orders indexes both a positive (+6 and +8 respectively) after having plunged to register deep negative readings in April (-22 and -14 respectively). Foreign orders were last weaker that April in May of 2005 and domestic orders were last weaker in June of 2003. The mid 2005 period is one that seems to bear up in comparison with the NTC weakness. The order rebound this month looks stronger than it is since it is a minor bounce from a deep hole last month. Belgian prices continue to register mounting pressures.
How weak are things?The current assessment is still mildly negative at a -2 reading, the same as in April. It was last weaker in January of 2008 at -5: so that’s no big deal - or is it? Foreign orders at a -7 after a -8 last month are more seriously weakened in the current assessment, suggesting that foreign-linked weakness is a more immediate concern. Recall the weak NTC readings and be aware that for Euro Area shipments outside each country that cross national borders but that stay inside the currency zone called EMU still count as exports in domestic statistics. We know that the EMU region itself is weakening. This is the sort of thing we have been waiting to see happen in the aftermath of the ongoing surge in the euro. Even so we have seen sporadic signs of resiliency within this weakening zone even amid other signs of weakness such as the odd spike up in Italian consumer confidence in May as Biz confidence fades and GDP registers borderline growth. For the record the NTC MFG index for Germany weakened only slightly in May (to 53.5 from 53.6) and its services index fell a bit more sharply (to 53.7 form 54.9)
Weakness across Belgium a geographically central-EU
state. Apart from industry the Belgian wholesale/retail index
fell sharply to -7.7 from -9.5 in April and +0.2 in March. It had
briefly resided at -8 in February of this year and then recovered - but
no more. It was last weaker in May of 2005 at -8.7. The construction
index is very weak as well, but it recovered to a -3.1 after posting a
-8.7 in April. It was last weaker in September of 2002.
The business services index at 15.0 was the huge surprise of the month. It jumped from a solid 6.3 in April when it was last weaker in August of 2005. This spurt in services is out of the scenario as far as the rest of the Belgian survey and the flash EMU services readings are concerned. One reason may be that Belgium packages trade as a separate sector from Business services instead of combing them under ‘services’. Mix consumer and business services together and the result is not so robust but is still a clear improvement in Belgium. The local services sector tends to be more isolated from the surrounding service sector reports than are MFG sector data.
Trying to position Belgian and EMU growth.Those lows in 2005 mark the time when the Euro Area was beginning to recover from its period of extended weakness. What we see is the new lows in the various components of the April 2008 Belgian survey go back to OR BEYOND that point, inviting comparisons with a time when things were bad and terms like euro-sclerosis were in vogue. The May overall Belgian reading shows some further slippage but is not as deeply weak as the April report was.
As we said last month when this same survey was issued: The ‘New Europe’ where the words ‘robust’ and ‘solid’ and ‘inflation-fighting’ have been the key terminology may now be past their vintage years. The euro consumer never did kick in as a force to support growth. Investment-led growth can only take you so far especially when the rest of the world is slowing and external demand for investment goods begins to dry up…and your currency is setting record highs while your central bank with inflation marginally over the target starts threatening to HIKE RATES!
For a time Euro Area growth seemed to be able to outlast weakness the way that Dorian Grey was able to outlast aging and death. But in the end these sorts of tricks are confounded by the forces of fundamentalism. Europe is beginning to show more widespread signs of weakness. Financial turmoil has hurt it and slowed it. The Bank of France this past month said that nonfinancial firms and consumers were not shut off from credit, still credit use slowed. Weakness in the US is doing its part too, to slow European growth. But now, surging oil prices may be the coup de grace. They have led to picketing and ports in France are disrupted by fishermen seeking more aid with fuel costs. Other groups are screaming for relief in Europe – some want excise tax relief. Energy prices, in the land where gasoline is already the equivalent of $9/gallon, are high. Economic disruption is afoot. On top of all the other pressures and given that oil prices affect the whole world this way (since most oil producing countries save and invent their enriched oil revenues) there is plenty of room for growth pessimists to come out of the wood work. With these higher oil prices ‘Growth Optimism’ is another endangered cottage industry. And the adverse impact is not even in the data yet.
| Belgium National Bank Indexes | ||||||
|---|---|---|---|---|---|---|
| May-08 | Apr-08 | Mar-08 | 3-Mo Change | 6-Mo Change | 12-Mo Change | |
| Total Industry | -1.6 | -7.9 | 1.2 | -1.8 | -3.0 | -5.5 |
| MFG | 0.0 | -7.4 | 1.1 | -0.5 | 0.5 | -3.9 |
| Production | 7.0 | 2.0 | 6.0 | 4.0 | 6.0 | 2.0 |
| Domestic Orders | 6.0 | -22.0 | 1.0 | 6.0 | 0.0 | 2.0 |
| Foreign Orders | 8.0 | -14.0 | 1.0 | 2.0 | 6.0 | 5.0 |
| Prices | 5.0 | 8.0 | 7.0 | -10.0 | 3.0 | -2.0 |
| Current assessment | ||||||
| Tot Orders | -2.0 | -2.0 | -1.0 | -5.0 | 2.0 | -6.0 |
| Foreign Orders | -7.0 | -8.0 | 4.0 | -7.0 | -2.0 | -8.0 |
| Inventories | 1.0 | 5.0 | 3.0 | -3.0 | -4.0 | 2.0 |
| 0.0 | 0.0 | 0.0 | ||||
| Wholesale & Retail | -7.7 | -9.5 | 0.2 | 0.3 | -15.9 | -15.0 |
| Construction | -3.1 | -8.7 | 2.9 | -10.1 | -6.8 | -3.4 |
| Business Services | 15.0 | 6.3 | 6.4 | 7.5 | 2.2 | 0.3 |
| Comparisons: | Changes lag one month | |||||
| EU Index: Industry | #N/A | -2.0 | 0.0 | -3.0 | -4.0 | -9.0 |
| Germany Index: Industry | #N/A | 1.0 | 2.0 | 0.0 | -3.0 | -8.0 |
| Compare: BNB Index | -7.1 | -6.0 | -11.7 | |||

Tom Moeller
AuthorMore in Author Profile »Prior to joining Haver Analytics in 2000, Mr. Moeller worked as the Economist at Chancellor Capital Management from 1985 to 1999. There, he developed comprehensive economic forecasts and interpreted economic data for equity and fixed income portfolio managers. Also at Chancellor, Mr. Moeller worked as an equity analyst and was responsible for researching and rating companies in the economically sensitive automobile and housing industries for investment in Chancellor’s equity portfolio. Prior to joining Chancellor, Mr. Moeller was an Economist at Citibank from 1979 to 1984. He also analyzed pricing behavior in the metals industry for the Council on Wage and Price Stability in Washington, D.C. In 1999, Mr. Moeller received the award for most accurate forecast from the Forecasters' Club of New York. From 1990 to 1992 he was President of the New York Association for Business Economists. Mr. Moeller earned an M.B.A. in Finance from Fordham University, where he graduated in 1987. He holds a Bachelor of Arts in Economics from George Washington University.
More Economy in Brief


