 Global| Oct 20 2016
U.S. Economic Growth Restrained By Broad Trends
by:Tom Moeller
|in:Economy in Brief
Summary
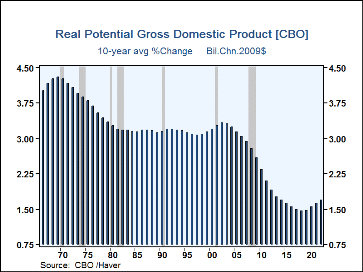
During the last 10 years, economic growth has averaged 1.4% per annum, well below the economy's 3-4% growth rates during earlier ten year periods. Nevertheless, it's the second longest period of positive economic growth since WWII. [...]
During the last 10 years, economic growth has averaged 1.4% per annum, well below the economy's 3-4% growth rates during earlier ten year periods. Nevertheless, it's the second longest period of positive economic growth since WWII. Past expansions ended as interest rates increased in response to the build-up of inflationary pressures, which reduced real incomes and prompted unwanted inventory accumulation. In the late 1980s, accelerated economic growth pushed prices higher. In the 1970s, higher oil prices and monetary accommodation spiked inflation. Currently, the low rate of price inflation sets the stage for continued economic growth. Growth may not be robust, however, as long-term economic forces are working to reduce the economy's potential.
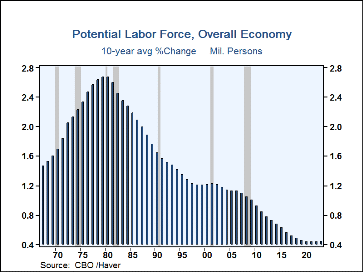
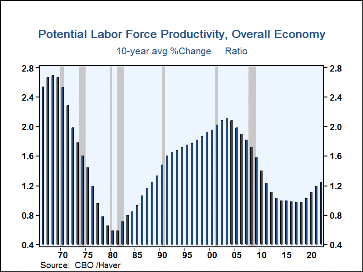
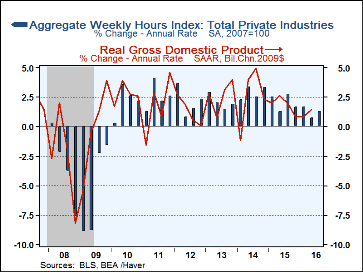
The economy's long-run potential rate of growth is determined by growth in the labor force as well as growth in productivity, both restrained since 2001. These broad trends have been behind the muted economic growth in recent years (see table below for ten-year averages since 1956).
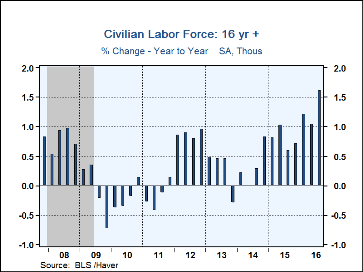
The labor market has changed. From the early 1960s until 2000, quick economic growth was fueled by 1.0%-2.5% annualgrowth in the labor force. The baby-boom generation matured, then its "echo-effect" emerged. (More individuals had children, albeit fewer in number.) This helped support the economy's growth potential. During the last ten years, however, labor force growth declined to 0.6% as the baby-boom generation aged. Moreover, some workers delayed entry into the job market and others simply dropped out of the workforce. This may help explain the fall in the unemployment rate from 10.0% at its 2009 peak to 4.9% currently. This year's figures show signs of change. Measured labor force growth has picked up to 1.5% in 2016 as the labor force participation rate has started to rise. After declining from a 2009 high of 67.1% to a 35 year low of 62.5% in last year's second half, the participation rate has averaged 62.8% so far this year. In the near term, a return of workers to the labor force after having been "discouraged" could signal a firming labor market, and better economic growth.
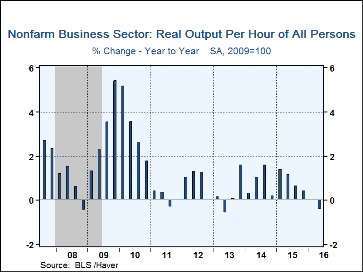
Growth in the productivity of labor eased during the last ten years to 1.0%, according to CBO measures which reflect potential GDP & potential labor force growth. During the prior 50 years, labor productivity averaged 1.7% growth per year, fostered by the strength of capital investment. It surged to roughly 2.0% in the early 2000s, helped by the information technology boom. The severity of the 2008-09 recession preceded a decline in productivity growth to 0.6% during the last five years. The sources of this decline have not been fully explained by the academic community, but they likely include a decline in public sector investment. Productivity has declined in the last nine months, a result usually reserved for recessions. Whether labor productivity growth will recover is a topic of heated discussion. The pessimists suggest that no rebound is in store since any benefit to productivity from the technology boom has worn off. Output of high-technology products has slowed to 5% from 20% or more in the late 1990s; and output of industrial equipment has been recently declining versus increasing at 8-10% rates in 2010-11. Optimists suggest that output is being understated due to poor measurement of the benefits to output and living standards from the high-tech boom.
To recap, a retreat in labor force and productivity growth damped the economy's potential in recent years. Moving forward, a very recent rebound in labor force growth plus the tenuous assumption that productivity improves would suggest a rise in potential GDP growth versus the last ten years. The current GDP forecast from the National Association for Business Economics calls for a 2.3% advance during all of next year. It would be on a par with growth since the economy's 2009 low, but still below growth during those years prior to the early 2000's. Whether the underpinnings of an improved rise in labor force and productivity support sustained improvement in real GDP growth remains to be seen.
The data used in this report can be found in Haver's USECON and the SURVEYS databases.
| Sources of Economic Growth (%) | 2006-2015 | 1996-2005 | 1986-1995 | 1976-1985 | 1966-1975 | 1956-1965 |
|---|---|---|---|---|---|---|
| Real GDP Growth | 1.4 | 3.4 | 3.0 | 3.5 | 3.1 | 3.8 |
| Price Inflation (GDP Price Index) | 1.8 | 2.0 | 2.8 | 6.2 | 5.3 | 1.9 |
| Real Potential GDP (CBO Estimates) | 1.6 | 3.1 | 3.1 | 3.1 | 3.8 | 3.8 |
| Labor Force Potential (Million Persons) | 0.6 | 1.1 | 1.3 | 2.2 | 2.3 | 1.4 |
| Productivity (Potential GDP/Potential Labor Force) | 1.0 | 2.0 | 1.7 | 0.9 | 1.4 | 2.4 |
Tom Moeller
AuthorMore in Author Profile »Prior to joining Haver Analytics in 2000, Mr. Moeller worked as the Economist at Chancellor Capital Management from 1985 to 1999. There, he developed comprehensive economic forecasts and interpreted economic data for equity and fixed income portfolio managers. Also at Chancellor, Mr. Moeller worked as an equity analyst and was responsible for researching and rating companies in the economically sensitive automobile and housing industries for investment in Chancellor’s equity portfolio. Prior to joining Chancellor, Mr. Moeller was an Economist at Citibank from 1979 to 1984. He also analyzed pricing behavior in the metals industry for the Council on Wage and Price Stability in Washington, D.C. In 1999, Mr. Moeller received the award for most accurate forecast from the Forecasters' Club of New York. From 1990 to 1992 he was President of the New York Association for Business Economists. Mr. Moeller earned an M.B.A. in Finance from Fordham University, where he graduated in 1987. He holds a Bachelor of Arts in Economics from George Washington University.
More Economy in Brief
 Global| Feb 05 2026
Charts of the Week: Balanced Policy, Resilient Data and AI Narratives
by:Andrew Cates


